Art of Peering
The Peering Playbook
To understand the tactics employed by ISPs it is important to first understand the motivations of two major classifications of ISPs in the Internet hierarchy.
For the Tier 1 ISPs, there are eight interconnection regions in the United States that collectively are referred to as “The Default Free Zone”. In each of these eight interconnection regions, the Tier 1 ISPs connect their networks together in private peering relationships. The motivation for peering is not to reduce transit costs since, by definition, Tier 1 ISPs don’t pay for transit. Rather, they seek to minimize their interconnection costs while providing sufficient interconnection bandwidth to support their customer base and their growth. For this reason, the only peering the Tier 1 ISPs need is with each other, and Tier 1 peering policies tend to reflect this.
The primary motivations for Tier 2 ISP Peering are to reduce transit fees. Any Internet traffic sent over peering links is traffic that does not go over the comparatively expensive transit links. For like-minded Tier-2 ISPs there is a clear financial win here to peer with each other.
The figure below shows the motivations of Tier 1 and Tier 2 peering players. Thicker arrowed lines reflect greater motivation to peer with the target ISP.
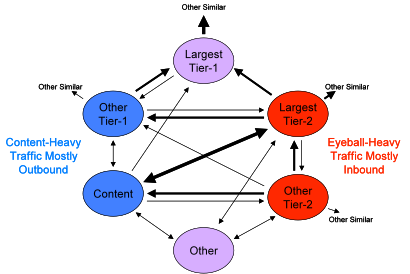
Figure 2 - Peering Motivations: Who wants to peer with whom?
Since the Tier 1 ISPs collectively represent 85% of the routing table, they represent the ideal peering candidates for the large Tier 2 ISPs. For a variety of reasons highlighted in the previous research, the Tier 1 ISPs are not as motivated to peer with the non-Tier 1 ISPs. Hence, as shown in Figure 1, the interest in peering is generally one-sided.
Success Stories. The research revealed success stories demonstrating ISPs that started with little or no peering and obtained wide spread peering in a short time period by using one or more of the enumerated tactics. For example, Digital Island Peering Coordinator Mitchell Rose established over 50 peering relationships using a variety of tactics described below inside of a year. In two years time, Telia migrated their Internet traffic from 85% transit and 15% peering to 15% transit and 85% peering through aggressively pursuing several of these tactics. Joe McGuckin (Via.net) has emerged with a blended traffic cost of $30/Mbps with a focused 80% peering mix.
Language: A Graphical Representation of Peering
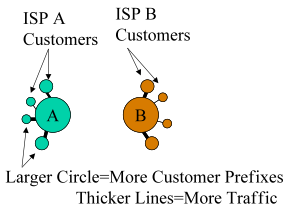
To convey these peering “plays” we will first introduce a graphical language created to graphically describe the maneuvers. First, the “ISP Initiator” is one initially interested in peering with the “ISP Target” as shown below. We will apply this color coded scheme throughout the paper as well.

The Customers of the Initiator and the Target are shown as same-colored circles attached to the ISP as shown below.
To convey the Peering and Transit negotiations process we use the directed arc between the ISPs as shown below. Where applicable, specific roles are represented using subscript letters. For example, APC indicates the Peering Coordinator is involved, and BS refers to a sales person at the Target ISP.
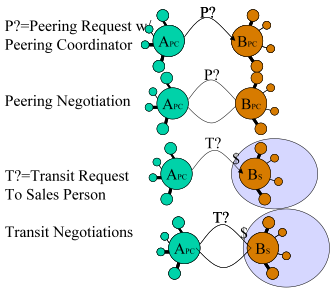
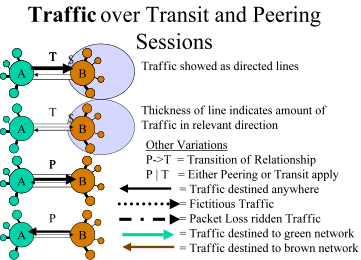
In order to show an Established Peering Session we graphically show the transport “pipes” with a ‘T’ to indicate Transit and a ‘P’ to indicate Peering. When Transit is shown we place a ‘$’ to indicate who is getting paid for transit.
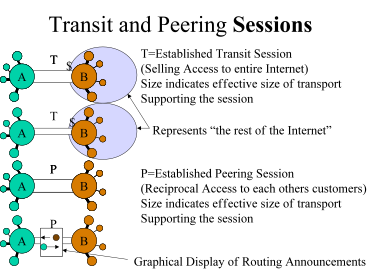
Finally, to demonstrate traffic going over the Peering or Transit pipe, we use directed lines as shown below. When the relevant traffic is destined to a specific network, the directed line is colored to represent traffic destined to the colored ISP. If traffic destination is not relevant, the color black is used. The thickness of the line represents the amount of traffic. Other variations will be presented as they arise during peering plays.


The Peering Playbook Diagrams
Now let’s see the methods that peering coordinators use to obtain peering.
The Peering Playbook will describe in graphical form the tricks of the trade that Peering coordinators use to obtain peering. We will use the following graphics to convey the tactics.
First, the ISP that initiates the peering discussion is shown as an “A” in a green circle, and the target of the peering courting is shown as a “B” in a brown circle.
The Peering Playbook
This rest of this article enumerates 20 tactics that have been used to obtain peering. Where appropriate, we highlight those tactics that are only applicable for obtaining peering with Tier 2 ISPs.

Internet Peering is defined as the reciprocal exchange of access to each others customers. It is typically done for free, although in 2009 we are seeing a resurgence of paid peering starting to occur.
But there are valid reasons for companies to not want to peer, and this article documents some of them.
We asked the smartest Peering Coordinators “What do you do when you get no response, or get a “no” repsonse to peering requests? Do you give up?”
This article documents the “Tricks of the Trade” for how they were able to obtain peering, where they otherwise would not have been able to.
We have given this presentation at dozens of locations around the world and to private audiences as well - the common thread has been “How would our NOC and Operations teams react to this?”
Each of these twenty tactics will be discussed in turn, but first, let’s talk a little bit about the peering ecosystem.
Figure: The 20 “Tricks of the Trade” - The Art of Peering - the Peering Playbook


8 U.S. Interconnect Regions
-
1)NY Metro
-
2)Ashburn, VA
-
3)Atlanta, GA
-
4)Chicago, IL
-
5)Dallas, TX
-
6)Seattle, WA
-
7)Bay Area, CA
-
8)Los Angeles, CA