
In previous research we documented three significant disruptions to the U.S. Peering Ecosystem as the Cable Companies, Large Scale Network Savvy Content Companies, and Tier 2 ISPs started peering openly. By peering content directly with eyeballs, they effectively bypassed the Tier 1 ISPs resulting in improved performance, greater control over the end-user experience, and overall lower operating costs.
This paper predicts a new wave of disruption that potentially dwarfs this previous redirection of Internet traffic. Short video clip web sites, full length motion pictures, and television shows are now available via streaming to on-line devices and via downloading to iPods. More sites are coming on-line High quality movies from independent producers are being distributed via peer-to-peer methods. We observe these flash crowd effects and the larger movie file sizes as the crest of the first wave of significant incremental load on the Internet.
The majority of this paper details four models for Internet Video Distribution (Transit, Content Delivery Networks, Transit/Peering/DIY CDN, Peer2Peer) across three load models. The cost models include network and server equipment along with pricing models for various distribution methods. Over one hundred walkthroughs of this paper have led to stepwise refinements of the models and insights into why one would prefer or not prefer one model over the other.
The summary of the paper is a comparison of these video distribution techniques in terms of $-per-video units from the Video Service Provider perspective. We highlight cascading obstacles preventing large scale delivery of video traffic using commodity transit in a single location. The CDN solution and the multi-site Transit with Peering solution bypass some of these obstacles, while the peer-2-peer solution, while controversial, yields (by far) the lowest cost solution from the video service provider perspective.
The U.S. Internet Peering Ecosystem went through three significant disruptions in or about 2001:
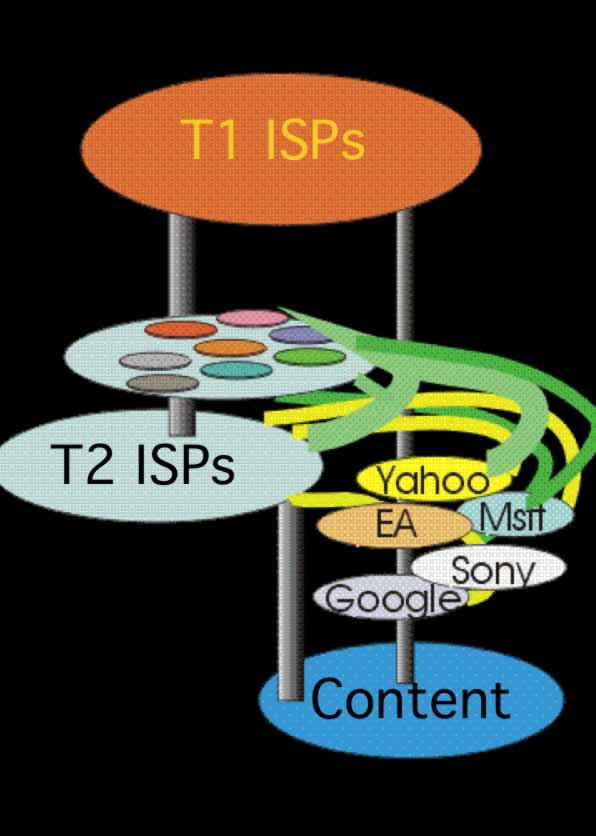
Figure 1 – 2001 U.S. Internet Peering Ecosystem Evolution
Peering directly saved these companies at least $1 million dollars a year each and it is estimated that this early wave of disruption to the Peering Ecosystem resulted in at least 100Gbps of peered traffic.
Sources and Notes ...
See “The Evolution of the U.S. Internet Peering Ecosystem” for a more detailed discussion of this. The term “Peering” is the reciprocal (and usually free) exchange of access to each others customers.
In 2006 we saw early indicators of an emerging and massive growth in the scale of potentially peerable traffic that may dwarf the previous wave of disruption:
As with all predictions, there will be disagreement on the details; nonetheless, this wave of Internet video traffic has the potential to dwarf the previous (100Gbps) disruption.
Sources and Notes ...
Brokaw Price, Sydney Peering Forum indicated that Yahoo! Had over 640 peering sessions and was addressing the challenge of determining which Asian countries were most conducive to regional traffic distribution. NANOG 37, San Jose, Peering BOF, http://www.nanog.org/mtg-0606/pdf/bill.norton.3.pdf This analysis was taken from an on-line by Robert Cringely: http://www.pbs.org/cringely/pulpit/pulpit20060302.html a digital video codec standard which is noted for achieving very high data compression. http://en.wikipedia.org/wiki/H.264 Ibid. Red Herring “DoveTail showcases HD Films” http://www.redherring.com/Article.aspx?a=18373
How can Video Service Providers distribute this much Internet Video traffic? The rest of this paper documents and compares four models for Internet Video Distribution:
David Cheriton (Sun Microsystems) makes the observation that this is really the question “Where does it make sense to cache the video content? Transit is caching at the seed of the tree, CDNs are caching at a mid-point in the hierarchy (at the peering points), and p2p is really caching at the leaf (“at grandma’s house”).
We are applying these four models across three load models:
Load Model A – Light Load: Every 5 minutes, 10 customers each start to download a 1.5 GB movie, resulting in an average 15GB five minute load. Whether completed in the five minute sample or spread across many 5-minute samples, the average load on the server will remain 15GB (see Appendix A for a discussion of this laddering effect) .
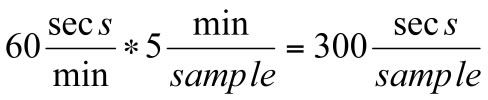
The 15 GB 5-minute load can be converted to GBps by dividing the 5-minute load by the number of seconds in each 5 minute sample: and then converted to Mbps by multiplying by 8 Gigabits-per-second per Gigabyte-per-second and multiplied by 1000 Mbps per Gbps: 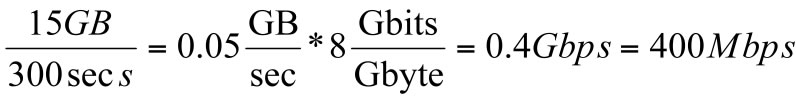
Adjust average load to sinusoidal demand curve. We have assumed a flat load across the month, but user Internet traffic load historically follows a sinusoidal curve pattern, with peaks during the waking hours and valleys in the middle of the night. The ISPs have a rule of thumb that the 95th percentile measure is typically about double the average for Internet traffic. However, Jeff Turner (InterStream) points out that video traffic demonstrates a peak-to-mean ratio of 6.6:1. This has two significant modeling implications:
Load Model B – Medium Load: Every 5 minutes users start to download 100*1.5GB movies, resulting in an average 150GB five minute load. Applying the same math as above we need to plan to pay transit on 16,000 Mbps and offload about 26,400 Mbps of video traffic.
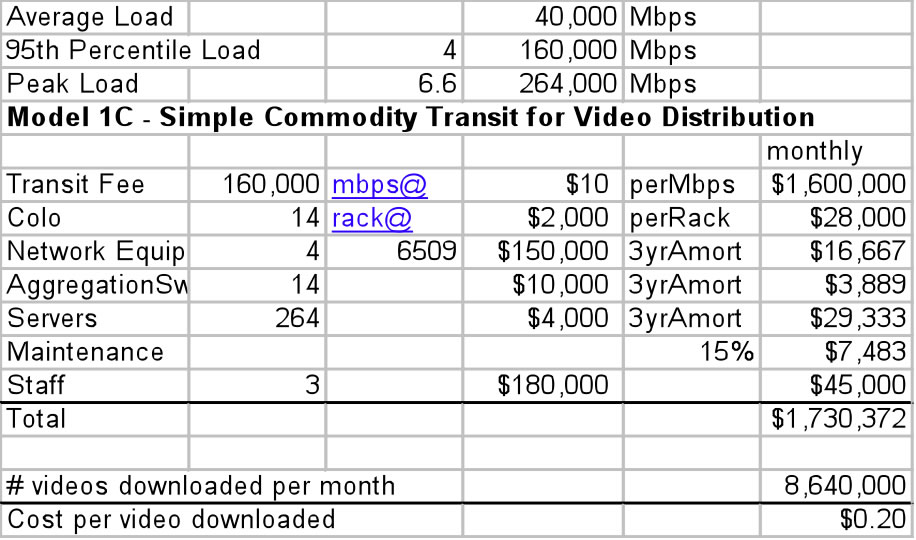
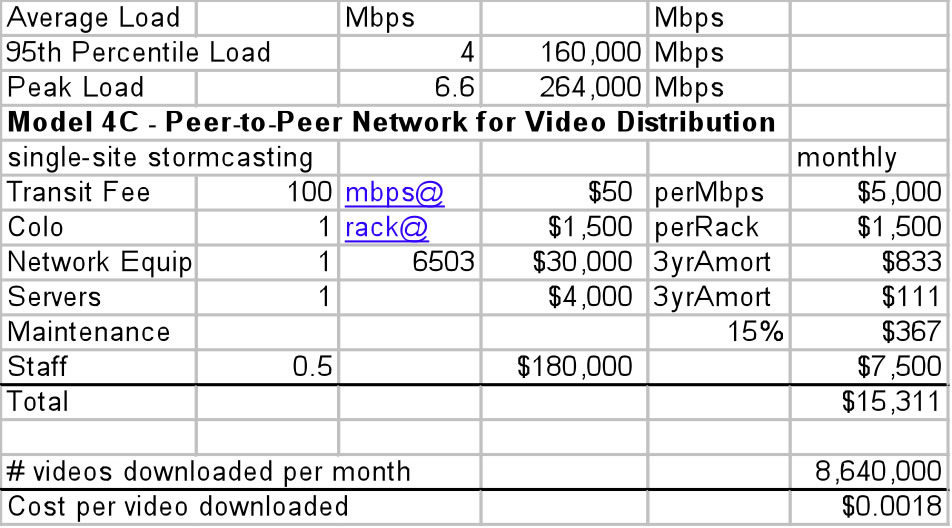
Load Model C – Heavy Load: Every 5 minutes 1000*1.5GB movies, resulting in an average 1500GB five minute load. Applying the same math as above, we need to pay transit on 160,000 Mbps and plan to offload about 264,000 Mbps of video traffic.
The VSP distributes 1000 full-length (1.5GB) feature films. We will assume that the VSP has a library of 1000 videos to distribute, each 1.5GB in size.
Equipment: Richard Steenbergen suggested that we model the servers using an inexpensive 2U Dual Core Opteron systems with 4GB of RAM, 4-500GB Disks, and 2 gigabit Ethernet uplinks to an aggregation switch. Each server can deliver up to 1Gbps aggregated across the two gigabit Ethernet links. The disks will hold 1000 videos at 1.5GB each with the remaining space for formatting overhead, OS, LAMP SW, miscellaneous scripts, etc.
There was some concern raised by reviewers as to whether the server as specified can indeed hit 1Gbps, given the likelihood of the request going to disk. The more simultaneous sessions, the more the disk I/O has the performance characteristics of random disk I/O. The alternatives suggested include: a) expect each server to deliver 400-500Mbps, and/or b) deploy SCSI disks and/or shared SANs, and/or c) increase the server size to 3U and use disk striping for increased performance, and/or massive memory configuration with substantially higher cost but increase chance of the I/O hitting the memory cache.
Aggregation Switch. The aggregation switch will handle up to 24 servers using its two ports to handle peaks of up to 24Gbps. We will accept only 20 servers however (across 40 ports) and therefore up to 20Gbps of traffic per switch so we will not oversubscribe to the upstream routers two 10G Ethernet cards.
Router. The router used is a Cisco 6509 class router with 10G ingress and 10G egress port(s) added as load demands. The model is shown in the diagram below.
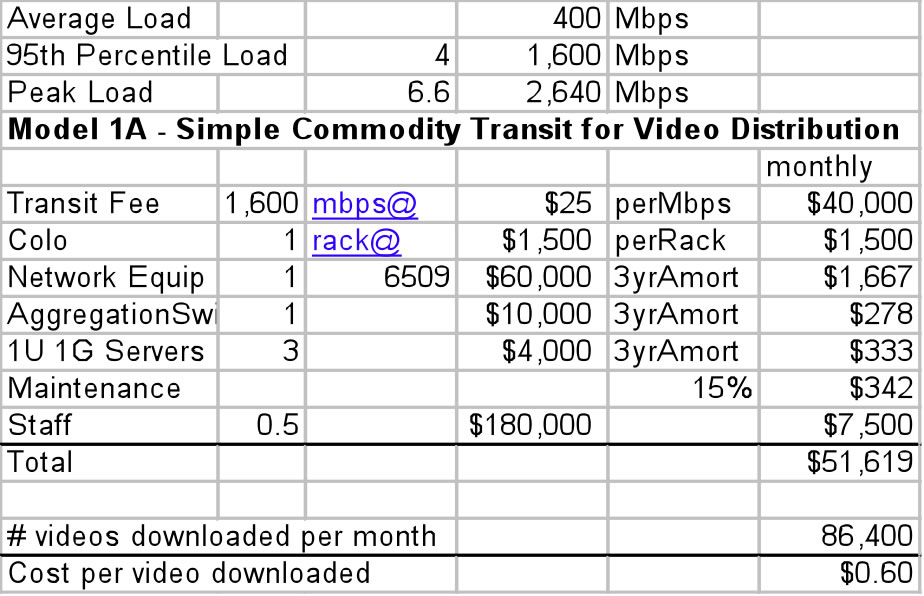
Sylvie Laperriere suggested that the equipment model should include a 15% maintenance contract so we have factored that into the model.
(It should be noted for all the models that there is great variability in network and server architectures and the corresponding equipment and vendor selection. We have modeled for simplicity instead of completeness and have selected a set of equipment, not necessarily the perfect fit for every type of traffic a VSP may be distributing.)
Software costs are zero with LAMP. It is assumed that the Video Service Provider is deploying open source software (as is the case with 60% of all web servers on the net ). We will model assuming LAMP (Linux, Apache, mySQL, and PHP) system components so this software is essentially free. We assume no customization or scripting costs.
Colocation Costs: We will assume that each model requires collocation at an exchange point (IX) for two reasons. First, the servers are assumed to be hosted somewhere, so there is a assumed to be some corresponding cost of housing. Second, we will assume an open market for transit, and in some of the models the ability to peer. In the U.S. these are typically accomplished at a collocation center that also operates a public peering fabric and/or private peering facilities.
Multi-homed: We are assuming that the VSP will be multi-homed to more broadly distribute the traffic to handle spikes, and provide some redundancy. Note that this implies:
Disk. Disk is inexpensive so we assume that each server is configured with at least 2TB, enough to hold the videos (10*1.5GB=1.5TB), the OS and support software. More important than the size, is the number and configuration of the disks. This has a material affect on the ability for the system to fetch and deliver the large video content. The system will essential grab data from one slow I/O system and sending it across the Internet through another slow I/O system. These are likely the two bottlenecks to be managed.
Digital Rights Management: We are ignoring the Digital Rights Management (DRM) issues, assuming that this will be settled by the VSP and Content Owners (if they aren’t one and the same).
Analysis. The end result of this analysis will be a summary per-video cost comparison table showing the four models across the three load models as shown by the matrix below.
| Models | A: Small Load Model (10 Videos every 5 minutes) |
B: Medium Load Model (100 Videos every 5 minutes) |
C: Large Load Model (1000 Videos every 5 minutes) |
|---|---|---|---|
| 1: Internet Transit | Model 1A | Model 1B | Model 1C |
| 2: CDN | Model 2A | Model 2B | Model 2C |
| 3: Peering & Transit | Model 3A | Model 3B | Model 3C |
| 4: Peer-2-Peer | Model 4A | Model 4B | Model 4C |
Notes and Sources ...
We assume stream homogeneity – specifically, that each stream has an equal share of available bandwidth so they start and stop roughly at the same time. Red Herring, 08.21.06, page 26 “More than 60 percent of the World Wide Web servers, for example, run open-source software.”
Business Premise: Video Service Providers outsource Internet video distribution to two or more transit providers in a single collocation center. The VSPs instead focus on the Content Server Operations, marketing, sales, etc. and oversight of the entire supply chain for video content. This is usually based on the following assumptions:
Definition: Transit is a business relationship whereby an entity sells access to the Internet to a customer.
Transit is best considered a pipe in the wall that says “Internet This way”. The customer sends its packets out to the Internet, and the transit provider announces reachability of the customers’ network to the rest of the Internet.
Transit in the U.S. is a metered service, charged on a megabits-per-second basis, measured at the 95th percentile. Traffic is sampled every 5-minuutes and the deltas are stacked lowest to highest every month. The 95th percentile value is used to determine the volume on which transit is charged.
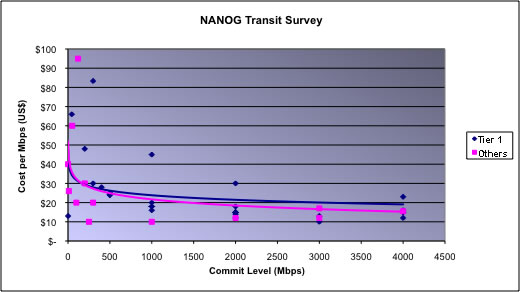
Wholesale transit prices in 2006 vary widely but appear to hover around $10-$20/mbps with a 1 gigabit-per-second commit as sampled at NANOG in February 2006 and as shown in the graph below .
Figure 3 – NANOG 36 Transit price Survey
However, these wholesale transit prices are not generally available to content providers. The traffic flow is almost entirely outbound which has the effect of adversely affecting the ISP’s traffic ratios . Further, we are assuming multi-homing so the bandwidth commit to any single ISP is split among multiple ISPs. Without the full volume commitment to a single transit provider, pricing may be a bit higher. To properly set VSP expectations, Jeffrey Papen (Peak Web Consulting) suggests we model Video Service Providers (VSPs) using slightly higher (approximately retail) transit prices. Based on walkthroughs of this paper we have settled on the following transit pricing :
Note: the pricing here has generated a lot of controversy. About half the reviewers say the prices are about right or a bit lower than the market price, and others stating that these prices are higher than the current market price.
Pro: Transit is Simple. One virtue of transit is that it is simple and the unit price decreases as the commitment increases. There is also a contractual obligation for the transit provider to deliver the content to the rest of the Internet, a feature that we will see later is not a feature of peer-2-peer systems. The transit provider takes the packets and delivers them to the rest of the Internet. This simplicity allows the content provider to focus on content creation rather than network engineering.
Con: Video Transit can be expensive. One potential downside of transit for video distribution is that the traffic volume can grow very large. At the same time, some video content (i.e. YouTube hits, new popular TV shows) exhibit viral qualities so the volume can also spike unpredictably. As a result, the cost can grow large and unpredictably. Consider YouTube for example; founded in 2005 and within a year it was already pushing 20 Gbps of video traffic across its transit providers.
To illustrate the costs involved, let’s assume YouTube was able to acquire transit at $10/mbps. With 20% monthly traffic growth, as shown in the graph below, the resulting expense would approach $1 million per month within the next year ! This is pretty expensive for a startup company, although we now know with the subsequent purchase by Google for $1.65B it turned out to be a good investment..
To illustrate the costs involved, let’s assume YouTube was able to acquire transit at $10/mbps. With 20% monthly traffic growth, as shown in the graph below, the resulting expense would approach $1 million per month within the next year ! This is pretty expensive for a startup company, although we now know with the subsequent purchase by Google for $1.65B it turned out to be a good investment..
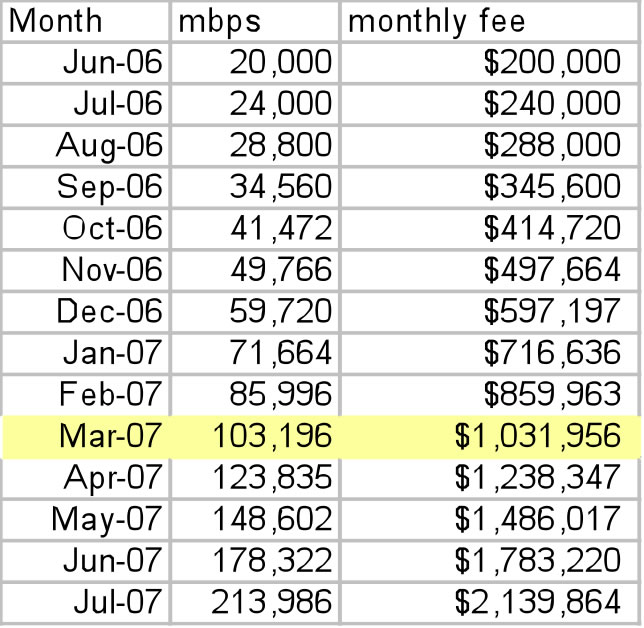
Figure 4 – Projected YouTube Transit Expenses
At least one source cites YouTube paying one million dollars per month already in September 2006 , and in March 2007 rumors have their traffic volume exceeding 200Gbps .
Now we will model the three video loads across each distribution model, starting with a basic commodity transit service.
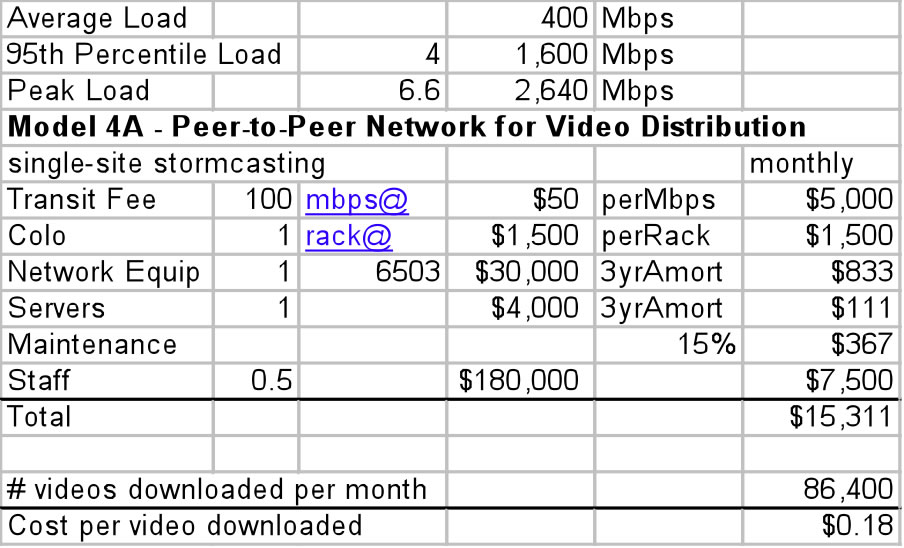
Here we need to construct a simple system to pass 2,640 Mbps peak worth of videos to distribute to a transit provider.
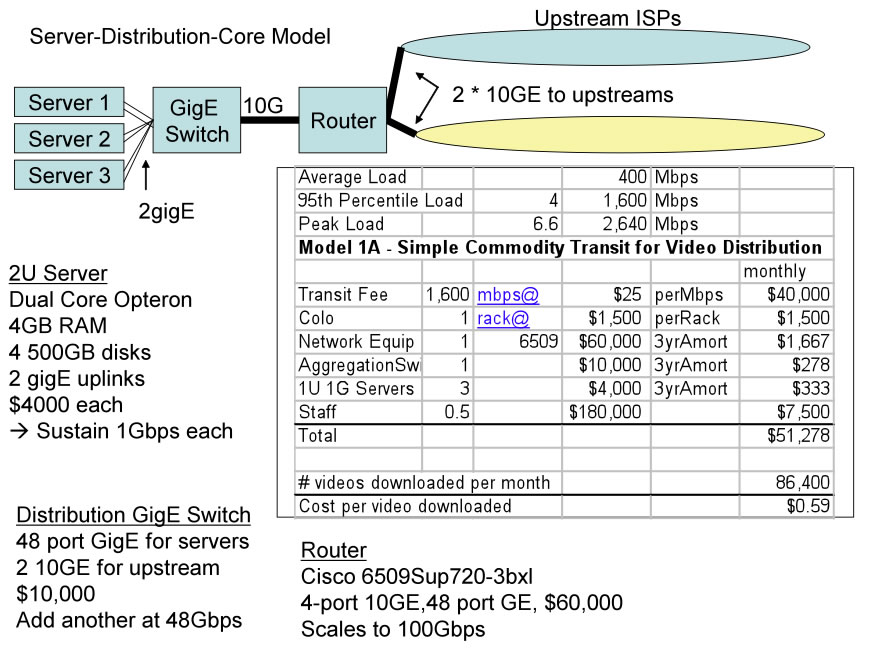
If we examine the monthly cost to the VSP we see that the greatest expense is in the transit fee. All other costs except staff are relatively insignificant. We assume for all models that the fully allocated cost of an experienced single Full-Time Equivalent (FTE) is $180,000 per year.
As one reviewer noted, a smaller router could have been selected, and no aggregation switch is required for this load model as the servers could be directly attached to a router Ethernet blade. We are assuming however that this VSP is planning to scale the infrastructure as the load increases. The larger router and aggregation switch assumes this scaling will occur at some point in the future.
We can scale Model1A to handle ten times more video traffic if we beef up the server and network infrastructure. At this point we exceed the capacity of the first distribution switch so we spread the load onto a second switch. We have also filled the first switch’s uplink capacity (the max 24Gbps from the servers can’t all fit across the two 10G Ethernet ports) so we will probably spread the server load more evenly across the switches.
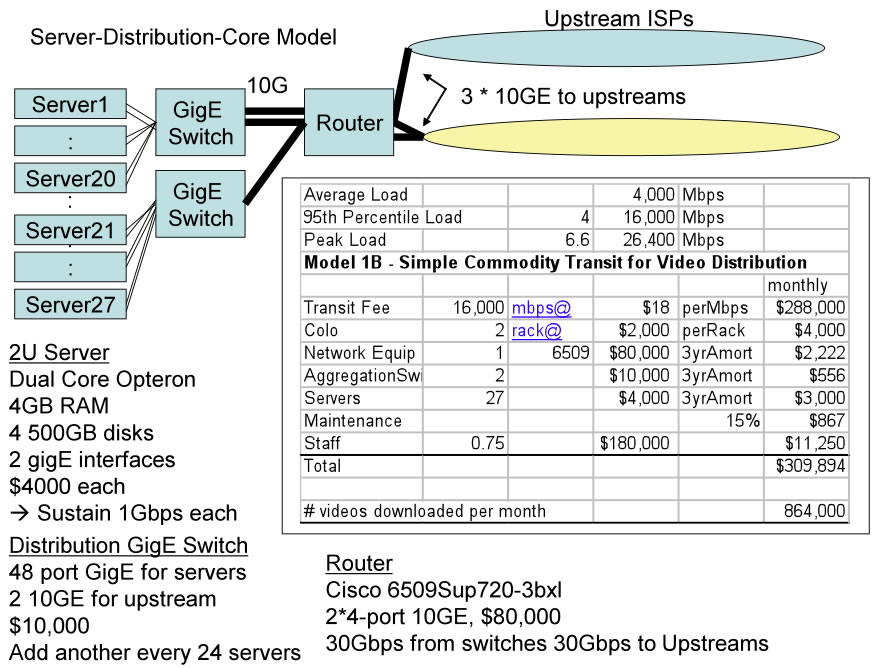
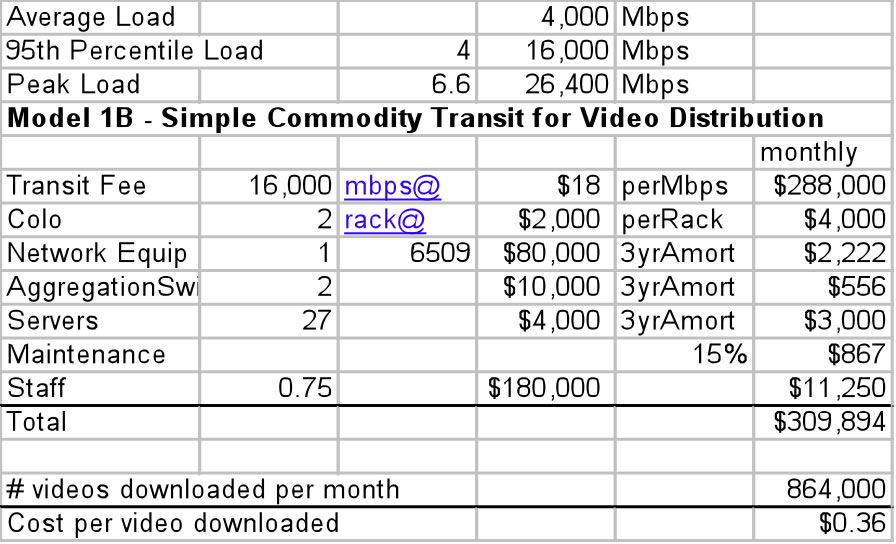
We observe here again that the transit fees substantially dominate the cost of video distribution in this model.
With this next model we stress the equipment but can still fit the traffic across four routers each connected to eight upstream ISPs at 10Gbps capacity.
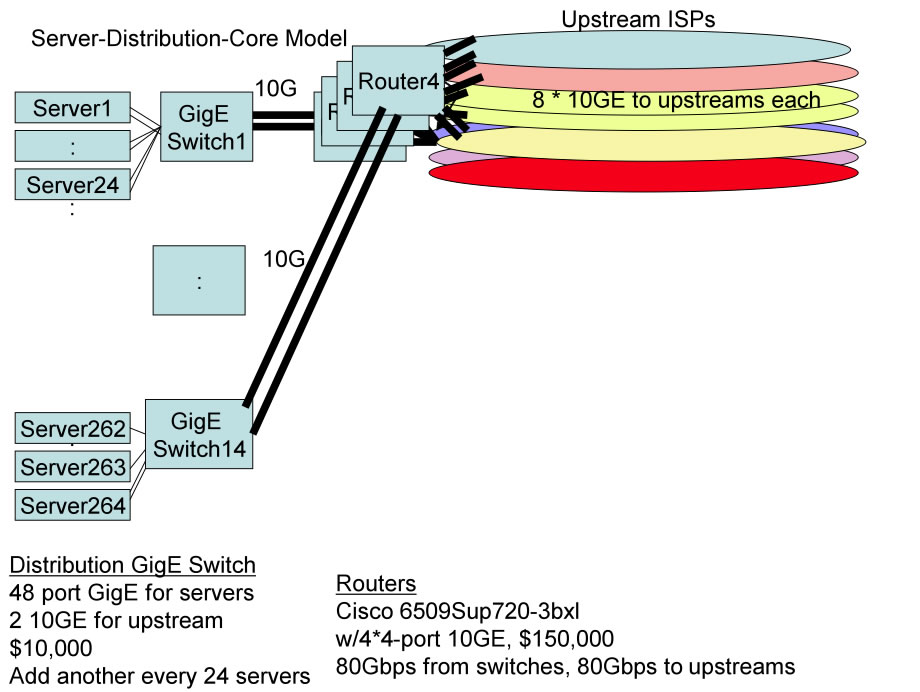
Here we clearly see that the primary cost component for distributing video is the transit expense. It is not even close. We could double or triple the server and networking equipment without making a dent in the overall cost model.
(Note: There were voices suggesting that the Cisco 6509s may be able to handle this load in the lab but may not work well in this configuration in a production environment. These reviewers suggested spreading the load across more routers and servers.
Cascading Failures. By far the biggest problem with this model is that there is no single location where the Tier 1 ISPs can all provision four ten gigabit per second links to the Video Service Provider. Several Tier 1 ISPs in the U.S. shared anonymously that they all face the following issues with respect to distributing video today:
A separate category of problem is that there is no standard for interfaces greater than 10Gbps, and those non-standard solutions that do exist involve trunking together multiple 10Gbps into 40Gbps aggregate links. These links do no benefit from the typical scaling characteristics exhibited before: that twice the price gets you four times the bandwidth. Here you get four times the bandwidth for about four times the cost. A 100Gbps solution appears to be 4-6 years in the future.
The solution to this problem may require the Tier 1 ISPs and IX Operators to synchronize the creation of more space and power and the ordering and deployment of new peering and backbone infrastructure. During the meantime, the Content Delivery Network solution looks like a good solution to explore for large scale video delivery.
Notes and Sources ...
Dave Wodelet (Shaw / BigPipe) shared the results of his transit survey at the previous NANOG 36 in Dallas: http://www.nanog.org/mtg-0606/pdf/bill.norton.2.pdf See “The Folly of Peering Ratios” white paper by the author for a more complete discussion of the ISP’s desire to maintain roughly symmetric peering ratios. The nice thing about models is you can change the numbers in a spreadsheet and see the effect. Feel free to request a copy of the spreadsheet from the author.
YouTube’s Peering Personals slide set at NANOG 37 in San Jose, June 2006: http://www.nanog.org/mtg-0606/pdf/bill.norton.3.pdf Rumors from the field is that in September 2006 YouTube already faces the $1M/month transit expense! –anonymous citation. http://www.datacenterknowledge.com/archives/2006/Sep/12/youtube_gets_bandwidth_boost_from_level_3.html Industry rumors from a variety of sources.
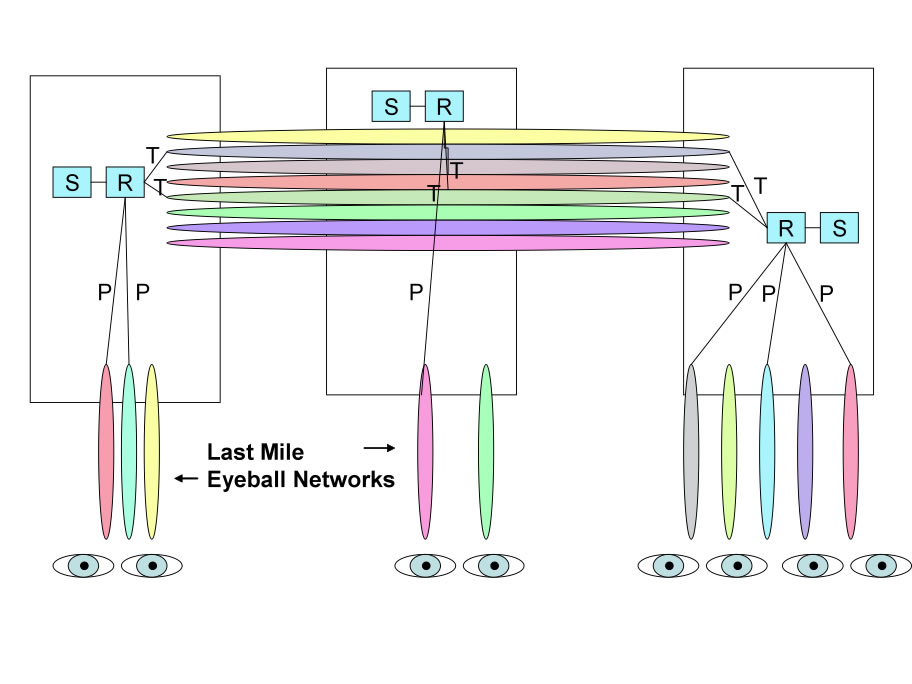
Business Premise: Single-site transit traffic may not be capable of handling the transit load. Further, traffic traverses potentially many network devices, increasing latency and the potential of packet loss. The CDN promises improvement:
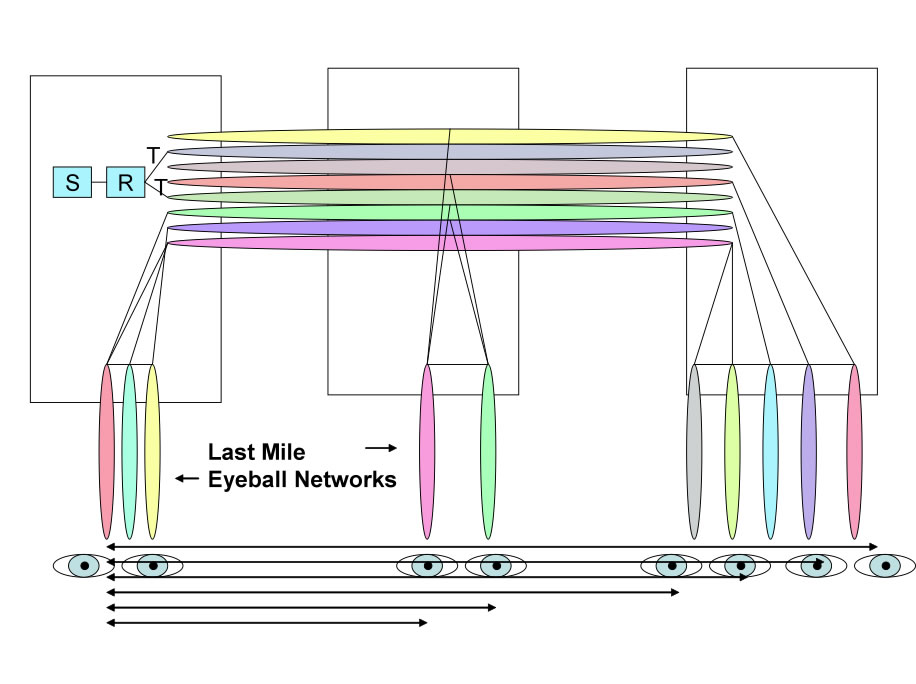
Pro: Remove the transit provider(s) bottleneck(s). What is important is the location of the bandwidth bottleneck. As David Cheriton says “You always want the content to be on the other side of the bottleneck (e.g. on the same side as the eyeballs).” The bottleneck will affect how large the TCP window size can grow before packet loss and poor performance occurs.
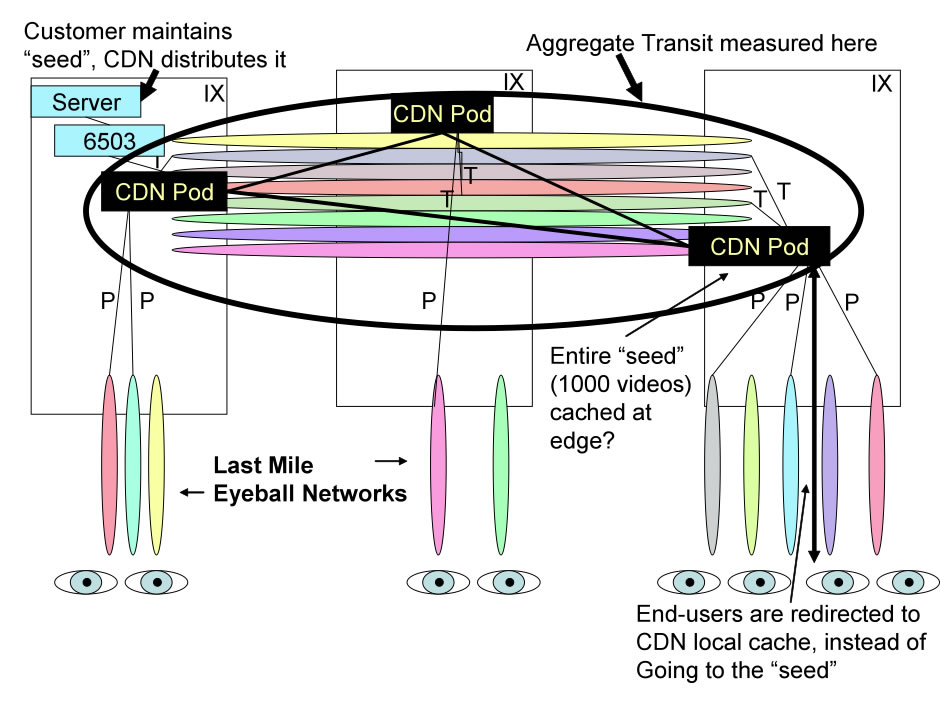
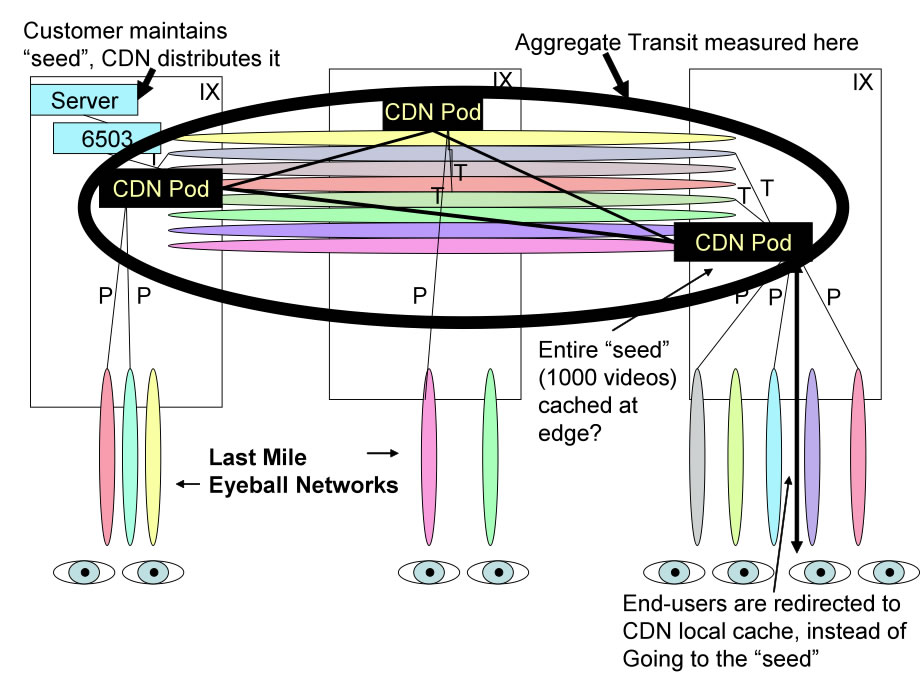
So the CDN distributes the content to the mid point in the hierarchy at the IX or within the last mile network.
To properly set expectations, Jeffrey Papen (Peak Web Consulting) suggests we use retail prices for modeling of VSPs using a CDN:
In all three CDN models, we do not need as large a server/network infrastructure since the CDN will pull the video objects once to seed the content across the CDN. The CDN then stores the videos at or near the edge, and distributes the videos to the end users from the appropriate “pod”.
There is some debate surrounding the benefits of a CDN for distributing these large video files.
Barrett Lyon (BitGravity) argues that video files are so large that the TCP congestion algorithm will grow its window size (amount of data transmitted without previous data delivery acknowledgement) to the maximum delay-bandwidth product. The further (latency-wise) away the eyeballs are from the data source, the more packets are “mid-air”. Let’s assume a loss-free network and no worse bottlenecks between the eyeballs and source. In both the close and distant source cases, once this maximum window size steady state is reached, the packet latency between the end points is less of a material issue.
The counter view is that the window size for the current era OSes has a maximum window size of 64K which is far from enough to fill the delay-bandwidth product pipe with packets.
Others argue the key problem with CDNs like Akamai is that the thousands of servers deployed are small servers incapable of holding the 1000 videos we assume in the model. Therefore, most of the requests will not be served from the edge but rather from a source further into the network. So, what is the incremental benefit of the video stream being served from somewhere in the middle of the Internet as opposed to from the origin server?
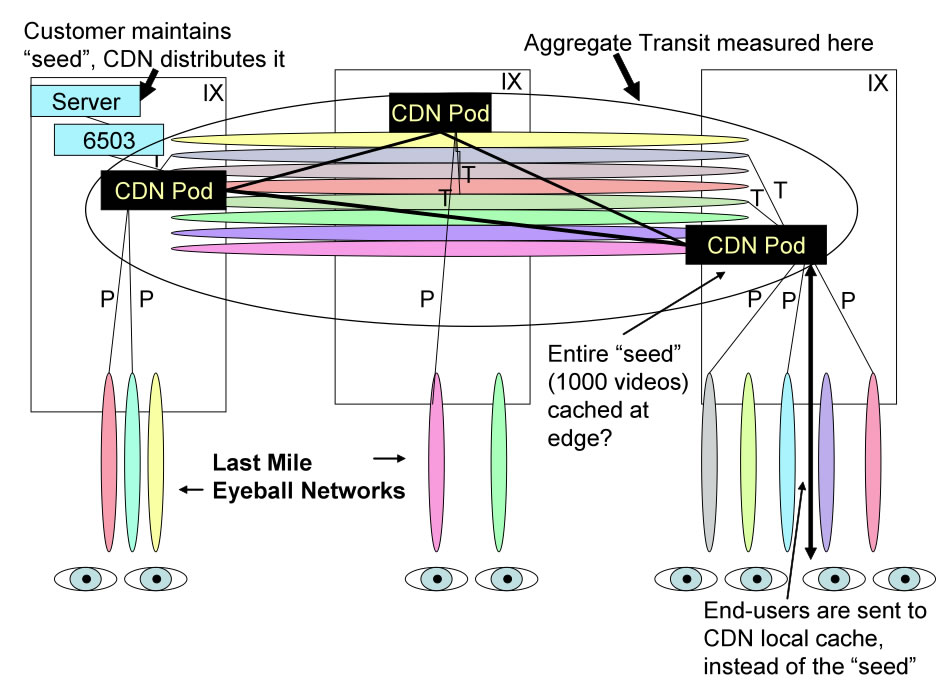
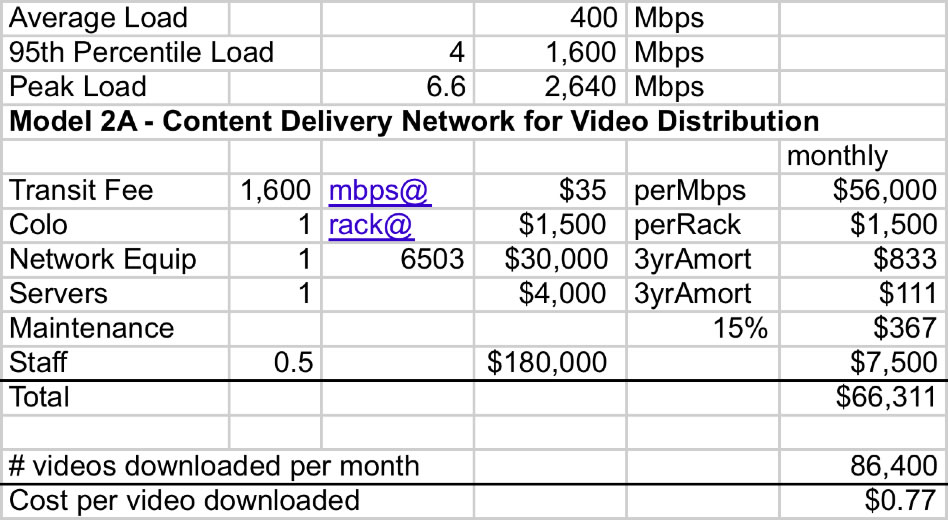
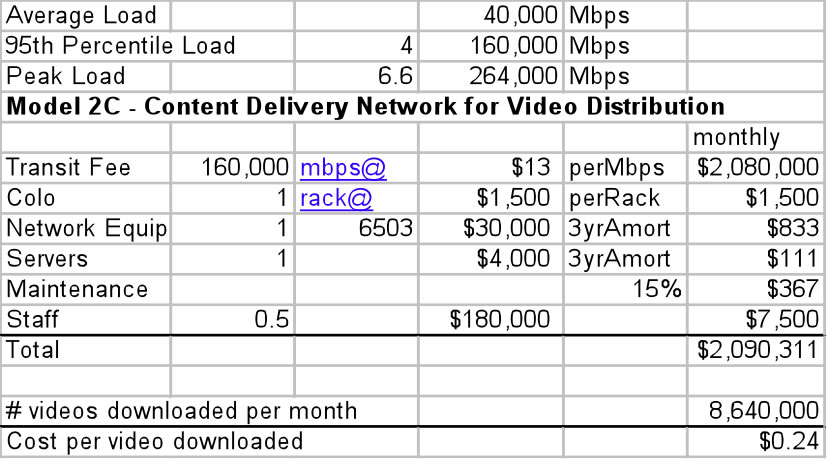
In any case, with model 2A the load is spread across the CDN and measured in aggregate across the CDN. Note that, as with model 1, video traffic distribution (called transit here) is the primary cost factor when outsourcing to a CDN, dwarfing all other costs. Since we pay a premium for CDN services, we have effectively increased the most expensive (top line) costs and reduced the insignificant costs.
The VSP server infrastructure remains the same regardless of the demand; the CDN handles all the distribution complexity of perhaps viral and unpredictable end user demands.
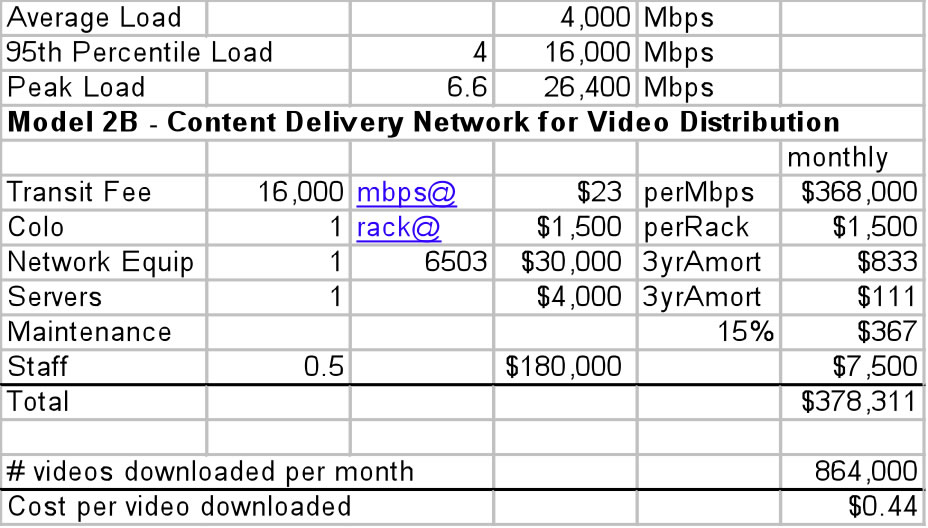
As we scale up the CDN to load model C, some reviewers expressed some discomfort outsourcing such a large amount of traffic to any single entity:
First, the Video Service Provider has better and advanced information about the popularity of new releases. The VSP may be able to time and manage network resources associated with these release events. To the CDN, these files are simply customer objects.
Second, while a CDN may be able to aggregate many companies loads efficiently, there is a chance that multiple customers have coinciding spot events that stress/break the shared CDN resources.
Third, there were concerns expressed about outsourcing this key operations activity to and company; a significant spot event, or any network related problems could severely effect the end customer experience and the VSP reputation. For these reviewers, control over the end-user experience was seen as a strategic requirement.
No surprises in the large load model, but the scale most clearly highlights the comparative cost of each part of the infrastructure. Again, we are increasing the most expensive component of the distribution (transit) while improving performance and reducing the internal cost of managing the video distribution.
Since so much of the cost to the VSP is in transit, some VSPs will consider taking the distribution in-house, which is discussed next.
Operation of the Internet distribution is seen as strategic to the VSP:
One reviewer points out a few additional motivations for some companies to build their own CDN:
Definition: Peering is a business relationship whereby two entities reciprocally exchange access to each others networks.
Is Peering for Content? Many of the largest Content Providers in the world are peering now. There are three primary motivations for peering. Peering provides the lowest latency path between two points. Peering bypasses the transit provider providing cost savings for both parties. Peering also provides greater control over the end user experience. Yahoo!, Microsoft, and Google for example have built out substantial networks and are peering at exchange points around the world. Yahoo! currently has over 640 peering sessions and a multiple- OC-192 (10Gbps) global backbone to distribute its content itself to peering and transit relationships .
Peering is not Free. There is a recurring flat monthly fee associated with public peering (switch port fees, collocation expenses, etc.) and private peering (cross connect or circuit fees, collocation, etc.). To compare peering against transit, one compares the unit cost of transit (in Mbps) against the unit cost of peering (in Mbps). Since peering costs are fixed monthly, the unit cost of peering varies based on the amount of traffic peered during the month.
The Peering Break Even Point (where the unit cost of transit equals the unit cost of Peering) is calculated using a lot of assumptions but in 2006 approaches 300Mbps . That is, the cost of peering is completely covered by the cost savings of peering at least 300Mbps of traffic that would otherwise traverse a metered transit service. Fortunately, as we will see, video traffic is so large that this breakeven point is met in even the light load model.
Con: Requires the Content Provider become a Network Operator. This means a content provider interested in peering needs a 24/7 NOC, networking expertise on staff, etc. a seasoned and talented Peering Coordinator is required to obtain peering. These requirements can be expensive and away from the core competence of a video service provider. On the other hand, some of these things may be already be in place, perhaps as required for some other operations activities.
We will make a number of simplifying assumptions for all 3 Transit/Peering models:
Three IX Deployments. Jeffrey Papen points out that three sites are sufficient to meet most geographic diversity peering prerequisites for the eyeball networks that would receive video traffic. More sites than that he argues would provide diminishing returns; the costs may exceed the incremental peers picked up.
No Backbone. These models assume that no backbone is used for the distributed VSP implementation based on Jim Gray (Microsoft) assertion that the most cost effective way of distributing large amounts of content is to UPS overnight disk drives . So, the servers and routers are shipped pre- configured with videos. It further assumes that updates (new releases) are infrequent and are distributed over a tunnel using a commodity transit services.
Each deployment independently can handle load. For simplicity, we will use three copies of the same equipment, ignoring efficiencies of distributing the load across all IXes. (If we assumed a uniform traffic load distribution across all IXes, we could for example chose fewer servers and smaller routers.) So Model 1A, 1B and 1C will each be deployed to three IXes across the U.S. resulting in three times the deployment cost.
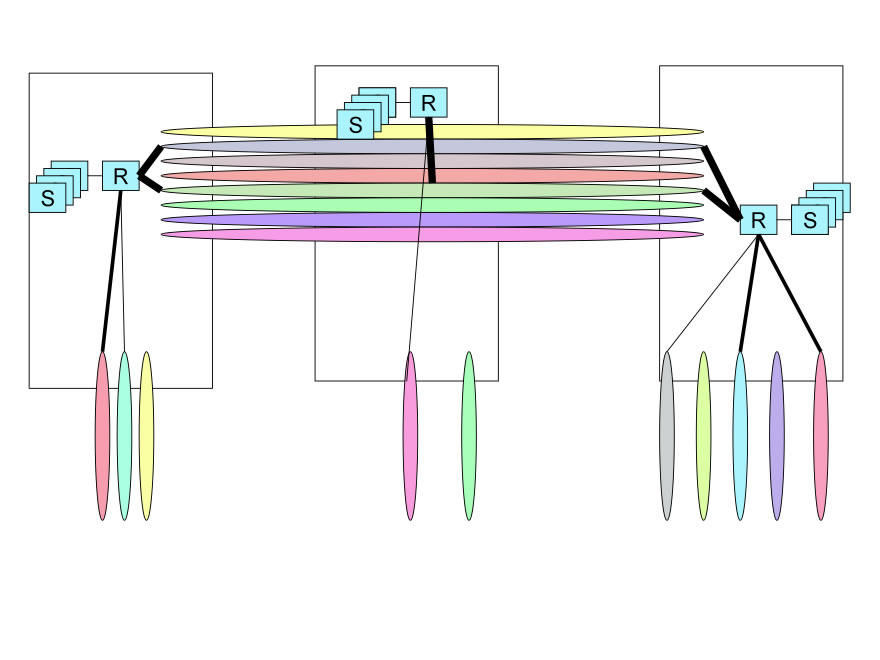
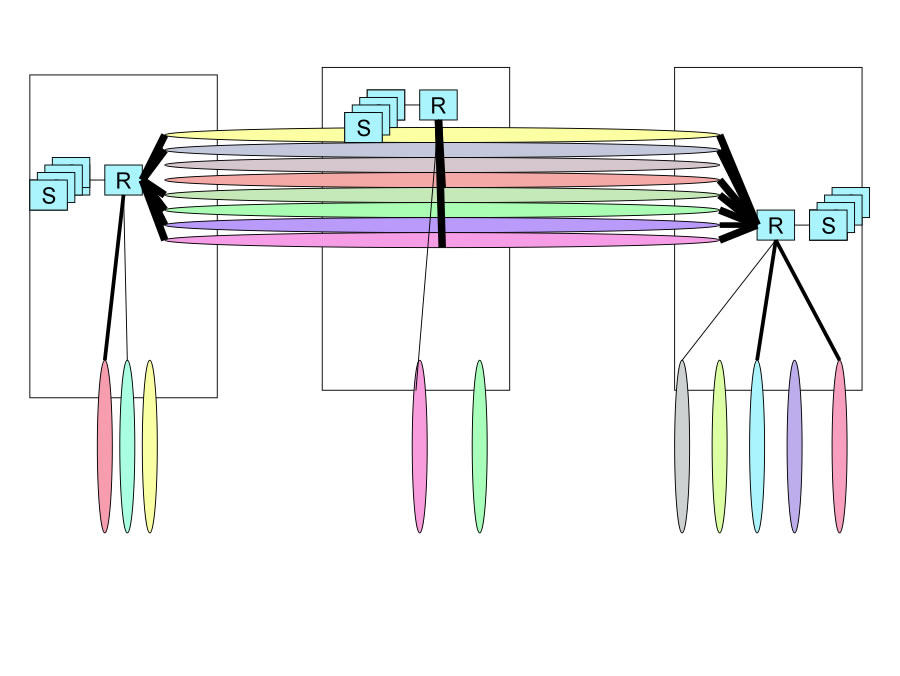
Purchase transit, peer in each location with an open peering policy and expert Peering Coordinator(s) as part of the network operations group. Active expert peering evangelism is required given the following five hurdles:
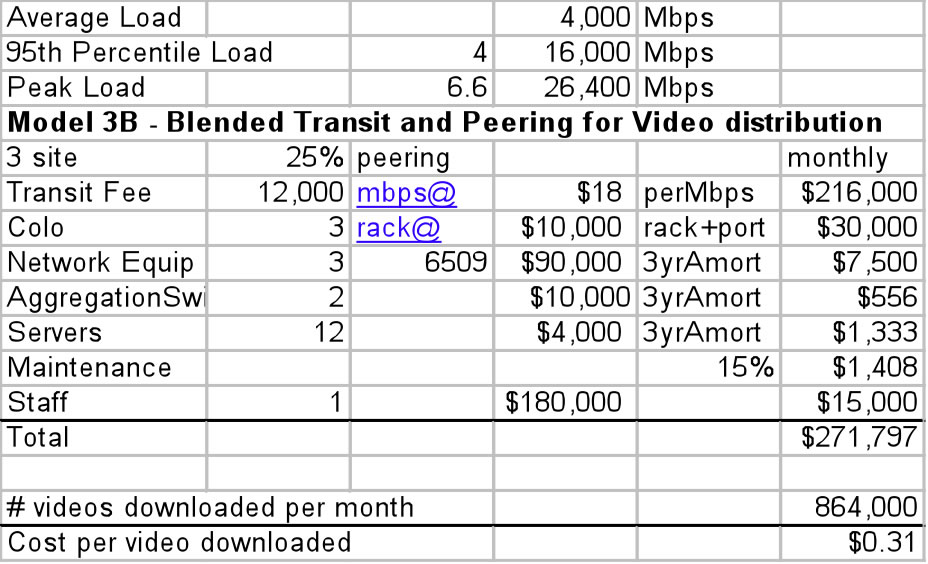
Here we will assume that the VSP is distributed to 3 IXes that are all reasonably well populated so the VSP can peer away 25% of their traffic. Jeffrey Papen (Peak Web Consulting) shared that his experience shows that 12%-18% of traffic can generally be peered in a single location. Barrett Lyon (BitGravity) believes the number to be closer to 40%, and with multiple sites connected by a backbone, Barrett claims a VSP should be able to peer away 60% of their traffic. We will assume that a conservative 25% of the VSP traffic is peered across the IXes resulting in the following financial analysis.
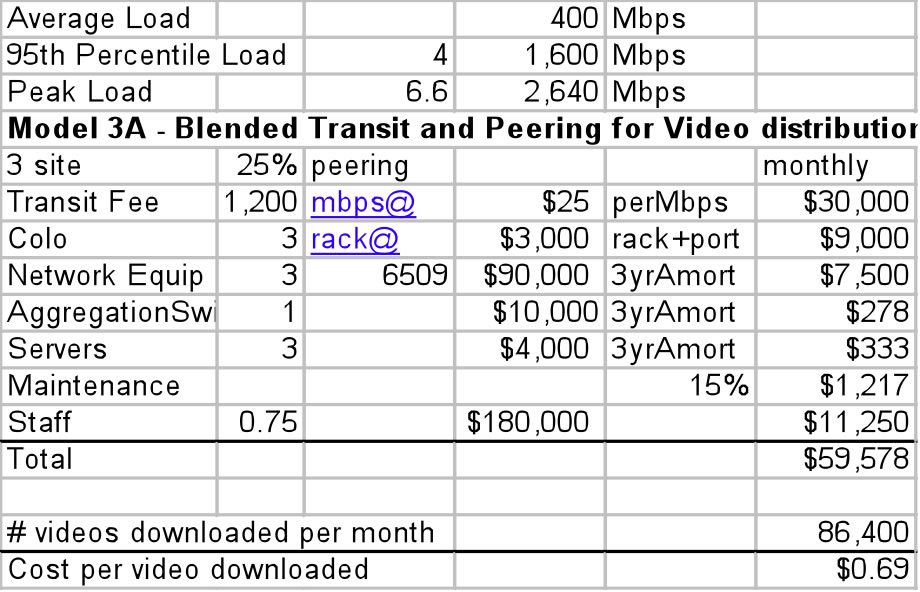
Here we are assuming that the per-IX expense is $3000 per rack inclusive of a 1G peering ports. With this model, 25% of the traffic is peered across the IXes decreasing the transit expense but with a corresponding increase in staffing and infrastructure. The benefits of peering are more pronounced with larger scaled deployments discussed next.
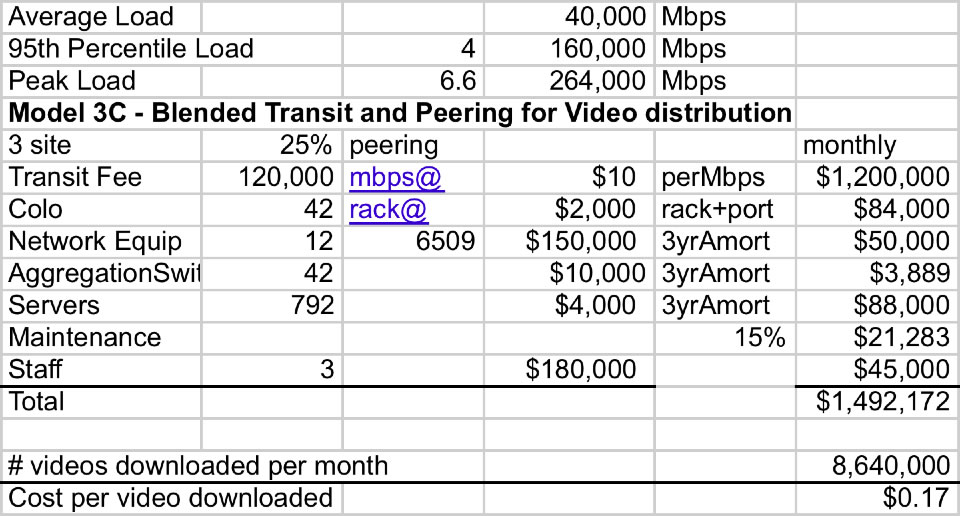
With this model we purchase the larger 10G peering port at greater expense, but at these higher loads, the monthly transit fees still dwarfs all other expenses. We have effectively however reduced the most expensive component by 25% resulting in an attractive cost per video.
The large load model presents significant hurdles from a political perspective.
First we are now offloading ten’s of Gbps to peers who most likely will need to spend capital to upgrade their equipment to handle the additional peering.
Finally, there is some evidence that these eyeball heavy networks operate network devices to throttle back heavy network users. The motivation for this deployment was initially the excessive peer-2-peer file sharing (copyright violating typically) user load. The point is that the scale by itself will attract attention and generate hurdles for the VSP deploying this much video across the commodity Internet.
With this model we purchase the larger 10G peering port at greater expense, but at these higher loads, the monthly transit fees still dwarfs all other expenses. We have effectively however reduced the most expensive component by 25% resulting in an attractive cost per video.
With this model we duplicate Model 1C across all IXes deploying a large number of servers. We assume the large number of servers will lead to a reduced average price per rack inclusive of peering ports. Again, the numbers in the model can be adjusted.
By far the most surprising side effect of this research was the discovery of the peer-to-peer economies for video distribution, discussed next.
The current Internet Service Providers and CDNs at the core can not effectively handle the video load across a single or even multiple locations:
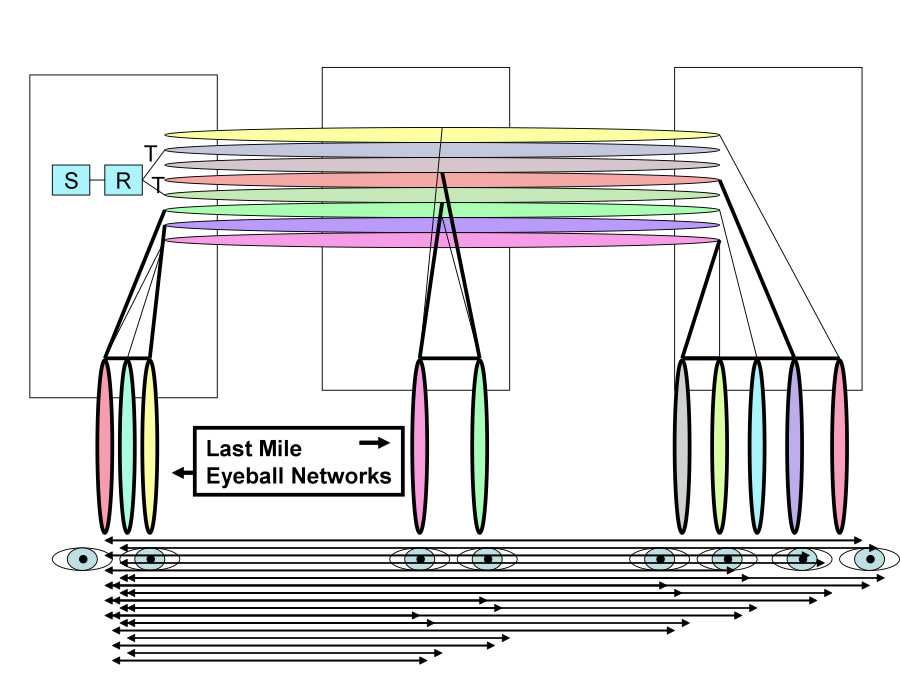
Peer-to-peer is compelling to the VSP since the load on the VSP infrastructure and therefore cost is minimal. With this low cost of entry, it should not be surprising that the author has discovered the most innovation occurring in the peer-2-peer space.
Peer-to-peer does however count on the good graces of the last mile operators allowing their customers to fill their pipes with this shared video content.
Cringeley suggests a Utopian peer-to-peer approach whereby 2.5% of the “Desperate Housewives” audience of 10,000,000 distributed randomly across the net could be given a feature like fast forward over commercials if they allow their machine and DSL line to be used in a peer-2-peer reflector mode. Then the rest of the 10,000,000 households would pull the pieces of the video files from these randomly distributed reflectors.
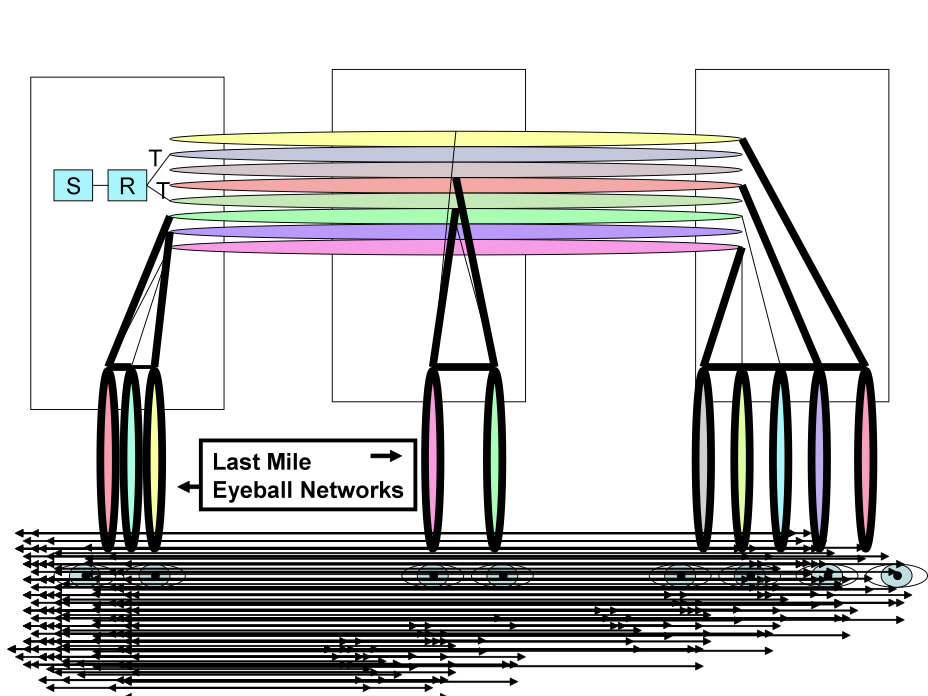
This spreading of the load is done with the expense of traffic distribution spread across the interested user base network infrastructure. The cost to the content provider here is only the cost of distributing the content to the 256,000 reflectors and perhaps some control plane overhead to manage this.
There will always be at least an initial spike in transit fees while the “seed” content is being distributed to “peers” in the peer-to-peer desktop sense. The transit load continues until the content is distributed to desktops topologically closer to the end-users requesting the file. Many p2p users today move completed downloads out of their shared directories making their sources unavailable to others. In response, many peer-2-peer networks use a give-to-get throttling tracker mechanism to encourage those people to keep their PCs seeding the content. As long as some desktops remain online and the source remains available, peer-2-peer remains a powerful and inexpensive alternative for distributing large scale video traffic.
Note that the cost to the VSP is very low, leading to a very cost per video. Reviewers observed that the cost of distribution is being simply shifted to the last mile providers.
The cost effectiveness of peer-to-peer is even more pronounced as we evaluate the more popular video content. Once the seed gets out from the origin, there are no additional costs for popular (seeded) content.
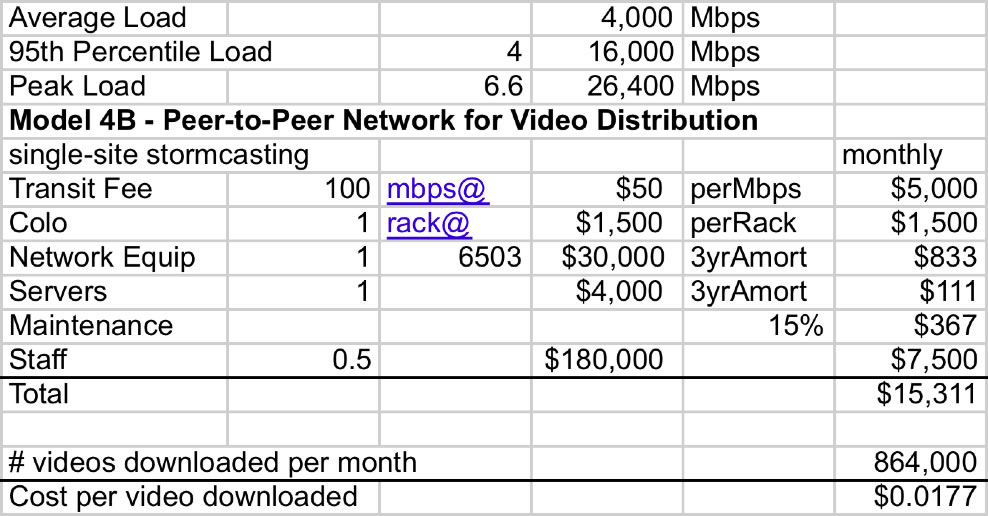
Posting details ... These cost characteristics more closely mirror the broadcast economics: There is a one time cost of broadcasting, and the more popular the video content, the more viewers and the more cost effective the (seeded) distribution.
The cost effectiveness of peer-to-peer is even more pronounced as we evaluate the more popular video content. Once the seed gets out from the origin, there are no additional costs for popular (seeded) content.
The cost of distribution is VERY LOW with peer-to-peer!
However, consider a few observations from the field:
On the other hand,
We discussed video distribution methods with over one hundred companies and documented the current thinking on video distribution over the Internet. We developed a model for each of four distribution techniques across three load models and highlighted the cost per video for using each model.
| Models | A: Small Load Model (10 Videos every 5 minutes) |
B: Medium Load Model (100 Videos every 5 minutes) |
C: Large Load Model (1000 Videos every 5 minutes) |
|---|---|---|---|
| 1: Internet Transit | 1A: $0.66/Video | 1B: $0.36/Video | 1C: $0.20/Video |
| 2: CDN | 2A: $0.77/Video | 2B: $0.44/Video | 2C: $0.24/Video |
| 3: Peering & Transit | 3A: $0.69/Video | 3B: $0.31/Video | 3C: $0.17/Video |
| 4: Peer-2-Peer | 4A: $0.18/Video | 4B: $0.0177/Video | 4C: $0.0018/Video |
From the data and analysis of the different network distribution schemes for video, given all the assumptions listed, we observe:
The white papers are constructed upon many hours of discussions with key members in the community and therefore have been made freely available to the community.
I would like to thank the following people specifically who provided good ideas, insights, suggestions, or in some cases just allowed me to walk through the white paper with them allowing me to flush out the logic: Vish Yelsangikar (NetFlix), Peter Harrison (NetFlix), Aaron Weintraub (Cogent), Jon Nistor (TorIX), Barrett Lyon (BitGravity), Dave Knight (ISC), Aaron Hughes (Caridien), David Filo (Yahoo!), Jim Goetz (Sequoia Capital), Jason Holloway (DoveTail), Matt Peterson, Richard Steenbergen (nLayer), Lane Patterson (Equinix), Eric Schwartz (Equinix), Pete Ferris (Equinix), David Cheriton (Sun), Andy Bechtolsheim (Sun), Jeffrey Papen (Peak Web Consulting), KC Broberg (Rackable), Henk Goosen (Sun), Geoffrey Noer (Rackable), Jeff Turner (InterStream/nuMetra), Vab Goel (NorWest Venture Partners), Ken Hubbard (Quad), Matt Wood (Equinix), Gary Baldus (LimeLight Networks), Sylvie Laperriere (VSNL), Ted Seely (Sprint), Bryan Sutterfield (Cox), Patrick Gilmore (Akamai), Phil Thomas (Quad), Doug Wilson (Microsoft), Christian Nielsen (Microsoft), Harald Willison (Covad), Davin Overland, Douglas Galbi (FCC), Ren Provo (AT&T), Susan Martens (AT&T), Richard Clarke (AT&T), the Google Network Engineering and Network Architecture team, James Blessing (Entanet), Sean Donelan (Akamai), Allan Leinwand (Panarama Capital), Patrick McCullough (Prism VentureWorks).
The Cringeley Report : http://www.pbs.org/cringely/pulpit/pulpit20060302.html
User-directed routing: from theory, towards practice,
Paul Laskowski UC Berkeley, Berkeley, CA, USA Benjamin Johnson UC Berkeley, Berkeley, CA, USA John Chuang UC Berkeley, Berkeley, CA, USA
Handbook of Peer-to-Peer Networking , Centre for UX Research / IBBT, K.U.Leuven, Parkstraat 45 Bus 3605 - 3000, Leuven, Belgium
Internet Transit Pricing Historical and Projections
Index of other white papers on peering
WIlliam B. Norton is the author of The Internet Peering Playbook: Connecting to the Core of the Internet, a highly sought after public speaker, and an international recognized expert on Internet Peering. He is currently employed as the Chief Strategy Officer and VP of Business Development for IIX, a peering solutions provider. He also maintains his position as Executive Director for DrPeering.net, a leading Internet Peering portal. With over twenty years of experience in the Internet operations arena, Mr. Norton focuses his attention on sharing his knowledge with the broader community in the form of presentations, Internet white papers, and most recently, in book form.
From 1998-2008, Mr. Norton’s title was Co-Founder and Chief Technical Liaison for Equinix, a global Internet data center and colocation provider. From startup to IPO and until 2008 when the market cap for Equinix was $3.6B, Mr. Norton spent 90% of his time working closely with the peering coordinator community. As an established thought leader, his focus was on building a critical mass of carriers, ISPs and content providers. At the same time, he documented the core values that Internet Peering provides, specifically, the Peering Break-Even Point and Estimating the Value of an Internet Exchange.
To this end, he created the white paper process, identifying interesting and important Internet Peering operations topics, and documenting what he learned from the peering community. He published and presented his research white papers in over 100 international operations and research forums. These activities helped establish the relationships necessary to attract the set of Tier 1 ISPs, Tier 2 ISPs, Cable Companies, and Content Providers necessary for a healthy Internet Exchange Point ecosystem.
Mr. Norton developed the first business plan for the North American Network Operator's Group (NANOG), the Operations forum for the North American Internet. He was chair of NANOG from May 1995 to June 1998 and was elected to the first NANOG Steering Committee post-NANOG revolution.
William B. Norton received his Computer Science degree from State University of New York Potsdam in 1986 and his MBA from the Michigan Business School in 1998.
Read his monthly newsletter: http://Ask.DrPeering.net or e-mail: wbn (at) TheCoreOfTheInter (dot) net
Click here for Industry Leadership and a reference list of public speaking engagements and here for a complete list of authored documents
The Peering White Papers are based on conversations with hundreds of Peering Coordinators and have gone through a validation process involving walking through the papers with hundreds of Peering Coordinators in public and private sessions.
While the price points cited in these papers are volatile and therefore out-of-date almost immediately, the definitions, the concepts and the logic remains valid.
If you have questions or comments, or would like a walk through any of the paper, please feel free to send email to consultants at DrPeering dot net
Please provide us with feedback on this white paper. Did you find it helpful? Were there errors or suggestions? Please tell us what you think using the form below.
Contact us by calling +1.650-614-5135 or sending e-mail to info (at) DrPeering.net
DrPeering.net ©2014 | Privacy Policy | Terms and Conditions | About Us | Contact Us
The 2014 Internet Peering Playbook is now available on the iPad at the Apple Store and for the Amazon Kindle. The Kindle, ePub and PDF form are also perpetually updated on the DrPeering DropBox share.