
LastModified: May 17, 2010
These last three are all small in comparison to the 51% state-owned Telstra. The eight hundred pound gorilla in the Australia Peering Ecosystem is the majority state-owned Telstra .
Australia is one of the few countries that has ventured into regulating Peering. In 1997 Telstra was forced to peer with Optus, Ozemail and Connect.com by the regulator (ACCC ). Interestingly, once the decree was made, these three Tier 1 ISPs were quickly acquired by foreign Tier 1 ISPs. This is a cautionary tale for other countries – a move intended to open up the markets ultimately only enable foreign competitors into the market !
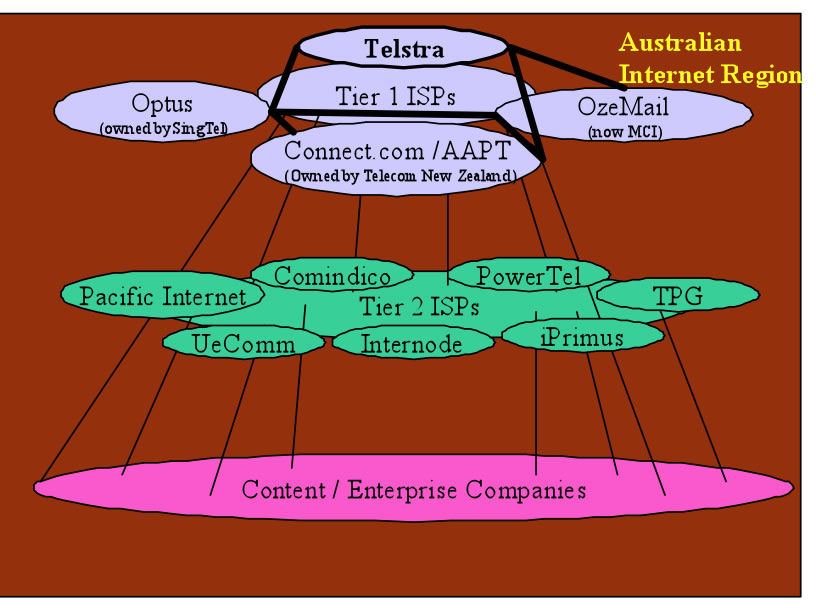
Figure 1 - Peering Ecosystem Diagram
Definitions. Within each of these Internet Peering Ecosystems we find at least three categories of players:
These rough classifications and definitions are important because they help us both
The Tier 1 ISPs in this Peering Ecosystem include
who collectively sell access to all routes in this ecosystem.
Restrictive Peering. The Tier 1 ISPs in Australia have restrictive Peering Policies. Telstra for example requires a 622Mbps interconnect capacity in each state, which is more capacity than can be supported by the entire state . James Spenceley (Comindico) said that they built a network to meet these stated requirements of an STM-4 into most major capitals at a cost of $420 million over 4 years . This allowed them to “try” for peering but faced the MILD (Make It Long and Difficult) peering negotiations approach described earlier.
James Spenceley (Comindico) and Gavin Tweedie (WAIX) shared their difficulties gaining peering with the Tier 1 ISPs in Australia at the APRICOT 2004 Peering Track. The “MILD” approach caused the delay of peering meetings with Telstra for 12 months, and with Optus 6 months. Rather than disclosing the Tier 1 peering policies and prerequisites, ultimately the focus of the discussions were Comindico’s currently deployed architecture and utilization. The view from Comindico was that this approach allowed the Tier 1 ISPs to specify prerequisites tailored to exclude the candidate peer! This is the definition of Restrictive Peering – the unstated intent is to deny peering .
Few Emerging Network Savvy Large-Scale Content Players. There are few of these players evident in Australia. Contributing reasons include a) the lack of Internet penetration, b) the disincentive to download content (volume-based billing) and c) the Australian government does not allow pornography to be hosted in Australia which has led to a bourgeoning market for off-shore hosters for this type of content . For these reasons the volume of content traffic may not have been sufficient to explore peering directly with the Tier 2 ISPs.
Definition: The Financial Value of an Internet Exchange is a measure of the financial value derived from an IX by its participants. It can be estimated by subtracting the collective cost of participation from the collective benefits of participation (sending that peering traffic over a transit service instead).
Let’s start the analysis by making a three simplifying assumptions.
First, the value an Internet Exchange point provides is facilitating the peering of traffic between participants. There are at least two dimensions to the value of peering: the value of the traffic volume peered, and the routes announced at the IX. We will only focus here on valuing the volume of traffic in this article; the routes announced deserves its own analysis.
Second, it is important to note that several large IXes have both public peering fabrics and private peering services. Private peering is traffic directly exchanged between two parties, often over a physical piece of fiber or a virtual private service. Being able to do both public and private peering represents a significant value of the IX, but unfortunately the traffic peered privately can’t be factored into the analysis since there is no visibility into the amount of traffic exchanged privately. For this reason, we will have to start out with the simplifying assumption that the value of the IX is proportional only to the value of public peering. (The LINX has migrated some large traffic flows onto private peering so as a result this analysis will consequently understate their value.)
Third, let’s assume that the alternative to peering is buying transit, so the value of the IX can be estimated to be
MarketTransitPrice * VolumeOfTrafficPeered
for free at the IX.
Under these assumptions, if the IX went away, the community using the IX would have to exchange that traffic with their transit provider at a metered rate. We further assume that the IX peak measure approximates the 95th percentile measure upon which transit is billed.
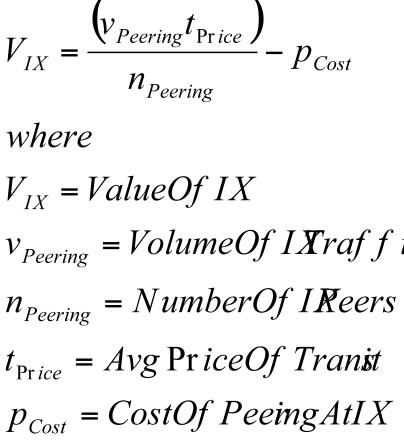
We say ‘peered away for free’, but public peering is not completely free. The cost of public peering includes some monthly recurring costs for each participant at the IX. If we subtract these costs from the value derived, we can estimate the value of the IX to the population:
ValueIX = TrafficPeeredAtIX * TransitPrice – CostOfPeering*NumberOfMembers
Observation: The Internet Exchange Points exhibit the characteristics of what economists call the “Network Externality Effect”; the value of the product or service is proportional to the number of users of the product or service .
Internet Exchanges are a special case of this effect; the value of an Exchange Point is not the number of participants but a slightly more complex calculation including the number and uniqueness of the routes and volume of traffic peered. Since the value of the IX to an ISP is proportional to the amount of traffic the ISP can exchange in peering relationships at the IX, the value of the IX to the peering population follows the network externality graph as shown below.
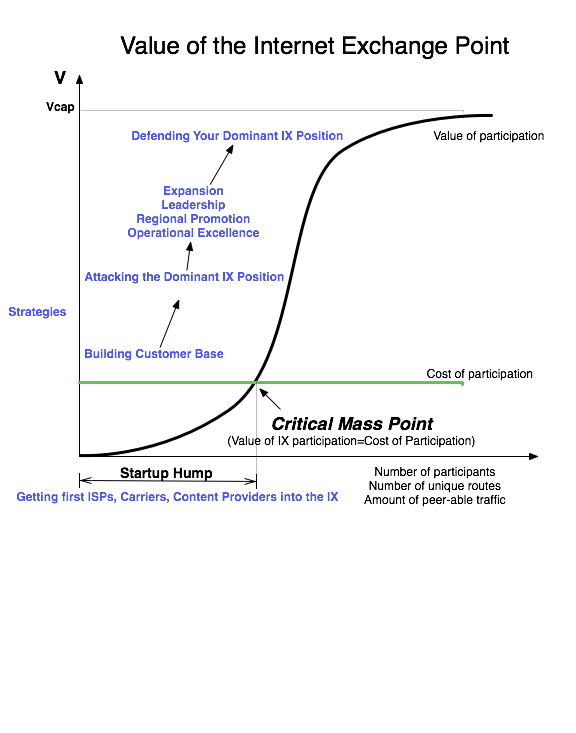
On the Y-axis we see the value of the Internet Exchange Point. On the X-axis we see the independent variable that causes the value of the IX to increase; we will use the number of participants for now; as more participants connect to the exchange for peering, the more value an NSP could derive from peering at the IX
All Internet Exchange Points go through the following growth curve. They start out with zero or a few founding ISP members, and face the challenge of attracting additional peers into a building where there are not many peers to peer with. This is the "startup hump", and solutions to this problem were shared with the author in "The Art of Peering: The IX Playbook".
Once the IX reaches critical mass, where the value of participation exceeds the cost of participation, the a well positioned IX experiences exponential growth.
Note: Some variables in this equation may be difficult to obtain.
Many Internet Exchange Points make the aggregate peering traffic volume available to the public, but some do not.
Further, private peering exchanges often utilize cross connects making it impossible to assess the total amount of traffic traversing their private exchange. This formula is therefore more accurately described as the value of a Public Internet Exchange fabric to the participants. To calculate the value of the Internet exchange, one would need to include not only the public peering fabric, but also the benefits of private peering and buying/selling transit in an environment where interconnection cross connects is less expensive than with local loops.
Be sure to chaeck out the Modeling an Internet Exchange Point for a list of the assumptions in this model.
Now we can estimate the value of the Internet Exchange Point, or at least the value of the public peering that we can measure at the Internet Exchange Point.
This Internet Peering Ecosystem has the following Internet Exchange Points:
Local Loops Expensive in Australia. Recent price quotes for a 4M Telstra local loop were $3375 retail ($2250 wholesale). At these prices, local loops are a major component of Australian peering costs. The billing for retail Internet transit in Australia is predominately volume-based billing, although 95th percentile now also available for ISPs.
Volume Billing Unique to Australia. Transit customers are billed for Internet traffic based on the volume of traffic downloaded, as compared with the 95th percentile 5-minute sample (or flat-rate) billing that is common in most parts of the world. This leads large ISPs to buy in bulk MB from the Tier 1 ISPs, and do the math to determine when/if it makes sense to get that volume of traffic from other places.
“It is often cheaper to get Australian routes in the U.S.” – James Spenceley (Comindico)
The required analysis to compare buying transport to the U.S. and buying 95th percentile transit as compared against downloaded traffic volume is shown in Appendix A.
Side Note: A related Peer-to-Peer story involves a grandmother in Australia that had her grandkids over during the holidays. In Australia, end users are charged for Internet access on a per-Megabytes-downloaded basis. When the grandkids wanted to hear the latest Britney Spears song on grandma’s computer, they installed Kazaa and downloaded the song. By default Kazaa shares all files it downloads, and soon grandma’s computer became the preferred source for the Britney Spears songs! Grandma’s bill from Telstra was several hundred dollars as opposed to the usual $25 she pays per month! In the U.S. where broadband is typically a flat fee there is no such disincentive to use all the bandwidth available.
James Spenceley (Comindico) claims that 40-50% peering is possible in Australia with 10 POPs and a national backbone network. He also claims that 25% peering in Australia requires only a modest effort. Is the effort worth it financially? Perhaps not. James estimates that Comindico spent $1.7M per year to build out in order to save $1.5M per year.
Western Australia Internet Exchange in Perth is trying to lure Telstra to peer there.
The business case for peering in Australia is pretty solid. This is largely due to the high expense of transit, the highest among the Internet Peering Ecosystems we explored.
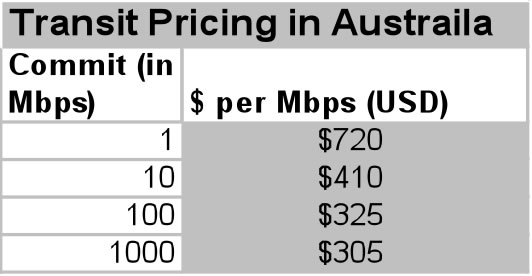
Figure 4 - The Price of Internet Transit in this ecosystem
Consider the example below of peering in Sydney at the Equinix IBX. Ethernet is the MAN media of choice for local loops.
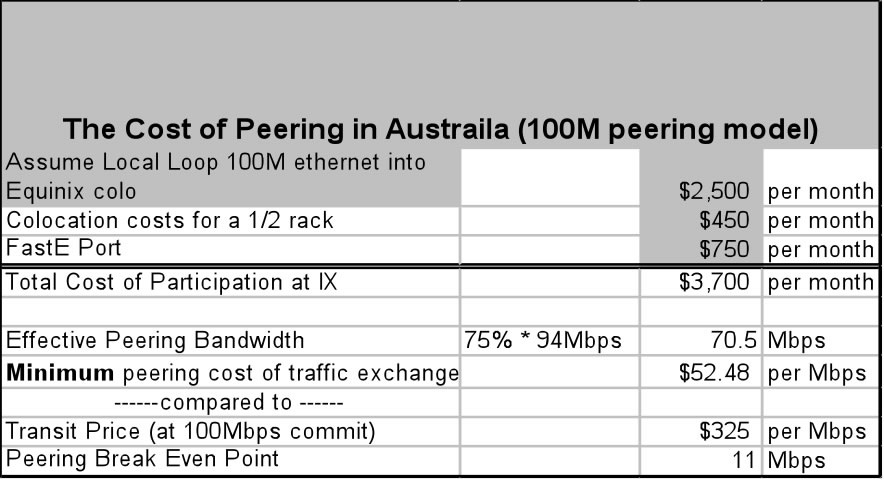
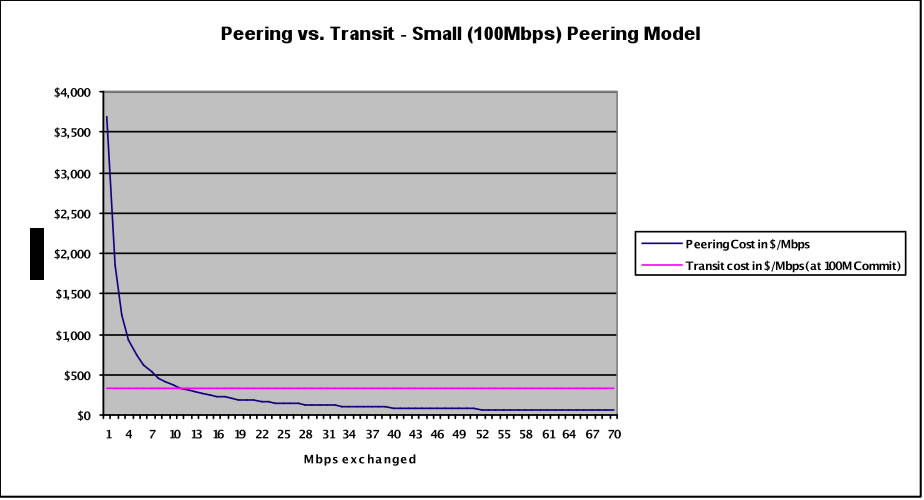
In the analysis above, we see that the total cost of peering at Equinix Sydney with a FastE might cost $3,700 per month including a local loop at $2,500 per month. If we assume the ISP or Content player is buying transit in Australia at 100 Mbps commit pricing of $325 per Mbps, we see a breakeven point of 11 Mbps where an ISP is indifferent between peering and transit. From that point until the Effective Peering Bandwidth of 70.5 Mbps, the ISP saves money by sending traffic to the peering point until the Minimum Cost of Peering Traffic Exchange is reached at $52.48 per Mbps. If an ISP can send at least 11 Mbps of peering traffic to peers at the IX, we can prove financially that it is advantageous to do so. This is shown in the graph below.
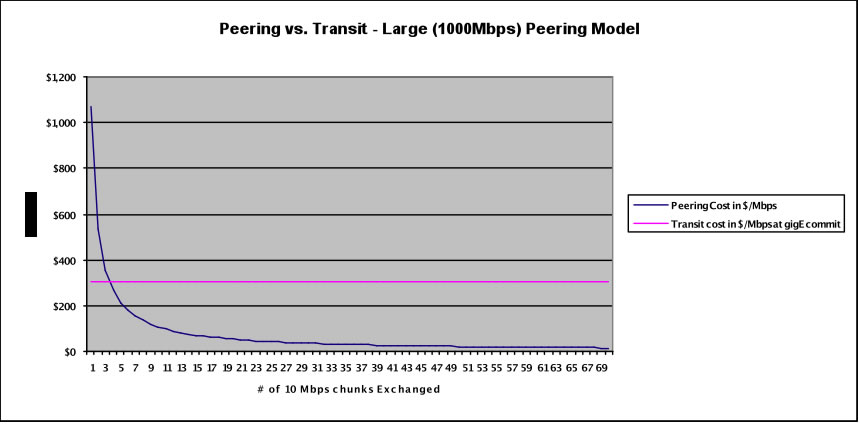
Peering at the gigabit level shows even more promise. If we assume that the ISP or Content company is coming in on a gigabit Ethernet with a cost of $7,500 per month we have a total monthly cost of peering of $10,720 per month. With an Effective Peering Bandwidth of 705 Mbps we see the ISP can possible get to a Minimum cost of Peering of $15.21 per Mbps, substantially below the cost of transit at a gigabit commit level of $305 per Mbps.
The price of transit in this market.
Figure 4 - The Price of Internet Transit in this ecosystem
Peering at the gigabit level shows even more promise. If we assume that the ISP or Content company is coming in on a gigabit Ethernet with a cost of $7,500 per month we have a total monthly cost of peering of $10,720 per month. With an Effective Peering Bandwidth of 705 Mbps we see the ISP can possible get to a Minimum cost of Peering of $15.21 per Mbps, substantially below the cost of transit at a gigabit commit level of $305 per Mbps.
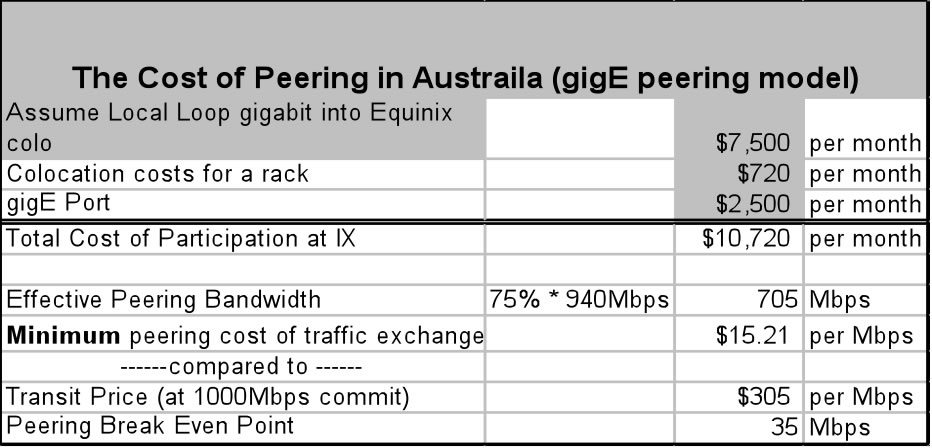
This is shown graphically below. Note that the cost of peering is below the cost of transit once the ISP can send 35 Mbps to the peering point. This provides the greatest Effective Peering Range in the regions we studied; from 35 Mbps to 705 Mbps the ISP is saving money by peering.
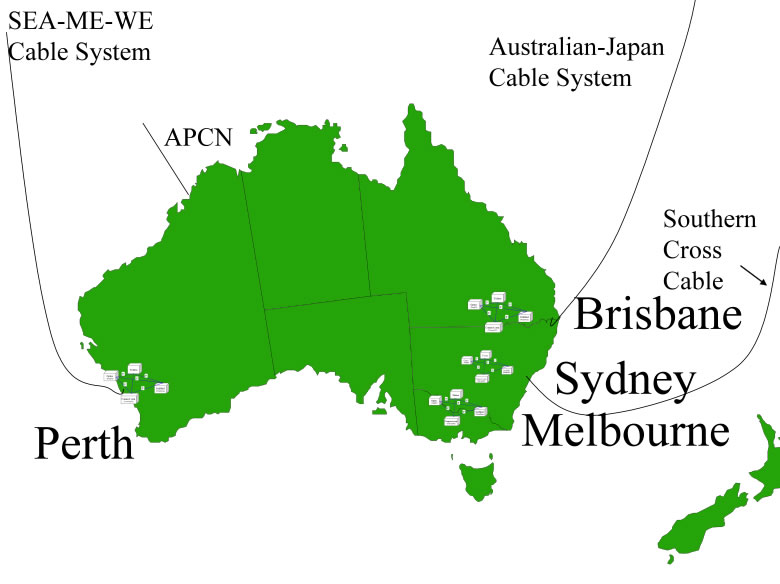
Domestic Peering Points in Australia. Australia is geographically the largest Peering Ecosystem we cover, and is unique in that:
As a result, we see
Transport within these metro areas is reasonably inexpensive, while transport between these major population areas remains quite expensive. It is not surprising therefore that one sees a different set of players at these regional IXes, with few connecting to multiple IXes.
DrPeering.net ©2014 | Privacy Policy | Terms and Conditions | About Us | Contact Us
The 2014 Internet Peering Playbook is now available on the iPad at the Apple Store and for the Amazon Kindle. The Kindle, ePub and PDF form are also perpetually updated on the DrPeering DropBox share.