
LastModified: *** May 17, 2005 ***
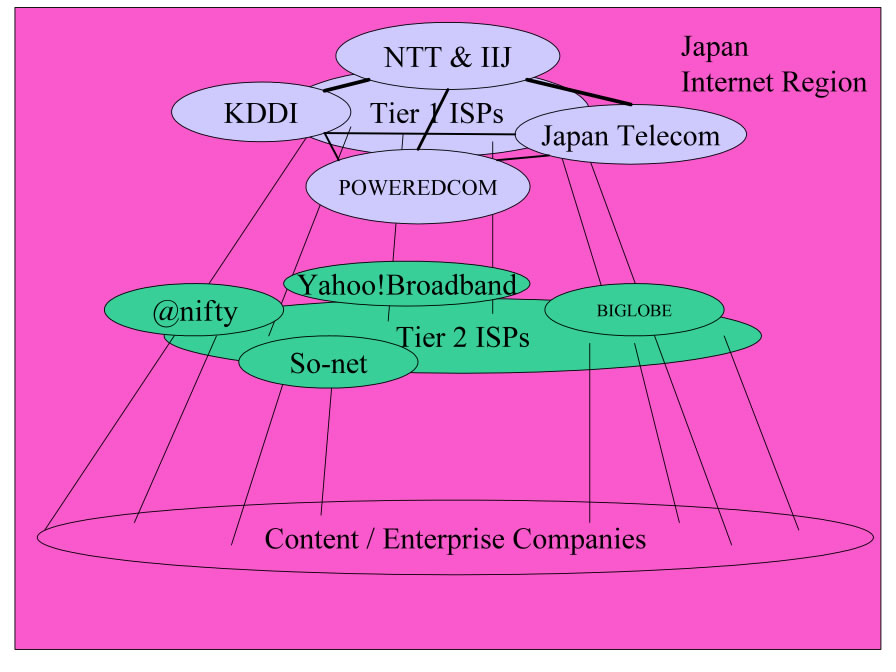
Figure 1 - Peering Ecosystem Diagram
Definitions. Within each of these Internet Peering Ecosystems we find at least three categories of players:
These rough classifications and definitions are important because they help us both
The Tier 1 ISPs in this Peering Ecosystem include
who collectively sell access to all routes in this ecosystem.
Because Japanese Eyeballs generally want to view Japanese Content, about 80% of all Japanese Internet Traffic stays within Japan . There is comparably smaller amounts of traffic destined to the U.S.; Fumio Terashima (Japan Telecom) estimates that less than 5% of all Japanese traffic is destined to/from the U.S. today , and that this 5% is between three and four Gigabits per second. This makes Japan one of the more self-contained self-sustaining Peering Ecosystems in Asia.
The Tier 1 ISPs in Japan generally own the Cable and DSL infrastructure so there is no substrate of open peering Cable and DSL providers in Japan as we have seen in the U.S. Ecosystem . There is however a major disruption in the Japanese Peering Ecosystem with Yahoo!Broadband (aka Softbank Broadband).
Softbank Broadband is offering DSL modems with capacity up to 40Mbps to the household for less than $50USD/month . Fiber to the Home (FTTH) is also widely available in this ecosystem for $100/mo. As of February 2004, Softbank Broadband is sinking about 48Gbps of traffic and sourcing 28Gbps . This volume of traffic has become a problem for some ISPs, with up to 70% of the traffic being Peer2Peer traffic. Those ISPs not well peered are paying the transit fees in Japan well beyond expectations and are rapidly seeking to peer with Softbank Broadband. Softbank Broadband’s recently purchased Japan Telecom, making them a Tier 1 ISP in Japan. It will be interesting to see if the Tier 1 status takes hold or if the other Tier 1 ISPs deeper them. It will also be interesting to see if Softbank Broadband takes this opportunity to restrict its peering and sell transit to ISPs.
Note: After word got out that the police raided a predominant Peer-2-Peer computer file sharer, a noticeable drop in network traffic occurred [ ]. The news of the raid caused people to turn off their computers and perhaps even de-install the file sharing software.
Voice over IP is taking off in Japan as well, with Yahoo! Broadband providing free on-net phone calls. The metered charge for off-net phone calls is nominal.
In late 2002 DSL providers made a significant market push in Japan with a $20-$30/month 8-40Mbps DSL offering . The number of subscribers doubled in the last year as a result .
With 49 Million Internet Users, Japan has the highest Internet penetration rate (39% of the population) of Asia .
The result of these initiatives :
Broadband Service Japan Customers (2002) DSL (8-10Mbps) 5,645,728
Fiber To The Home (FTTH) 206,189
with the broadband customer based expected to grow to 35M by 2005.
Streaming applications are huge in Japan; instead of using 300Kbps rates for streaming video they are using 1Mbps rates, largely spurred by the DSL capacity now available to the home. Yahoo! Broadband has made great strides in deploying broadband using NTT copper . Streaming media in Japan includes live news feeds, video-on-demand applications, interactive adult and other video chatting, horse racing sporting events.
Content companies in Japan generally collocate with and buy transit from Tier 1 ISPs, so there is no evidence of the evolution of Japanese Network Savvy Large Content group that engages in peering either as we have seen in the U.S. Peering Ecosystem.
Definition: The Financial Value of an Internet Exchange is a measure of the financial value derived from an IX by its participants. It can be estimated by subtracting the collective cost of participation from the collective benefits of participation (sending that peering traffic over a transit service instead).
Let’s start the analysis by making a three simplifying assumptions.
First, the value an Internet Exchange point provides is facilitating the peering of traffic between participants. There are at least two dimensions to the value of peering: the value of the traffic volume peered, and the routes announced at the IX. We will only focus here on valuing the volume of traffic in this article; the routes announced deserves its own analysis.
Second, it is important to note that several large IXes have both public peering fabrics and private peering services. Private peering is traffic directly exchanged between two parties, often over a physical piece of fiber or a virtual private service. Being able to do both public and private peering represents a significant value of the IX, but unfortunately the traffic peered privately can’t be factored into the analysis since there is no visibility into the amount of traffic exchanged privately. For this reason, we will have to start out with the simplifying assumption that the value of the IX is proportional only to the value of public peering. (The LINX has migrated some large traffic flows onto private peering so as a result this analysis will consequently understate their value.)
Third, let’s assume that the alternative to peering is buying transit, so the value of the IX can be estimated to be
MarketTransitPrice * VolumeOfTrafficPeered
for free at the IX.
Under these assumptions, if the IX went away, the community using the IX would have to exchange that traffic with their transit provider at a metered rate. We further assume that the IX peak measure approximates the 95th percentile measure upon which transit is billed.
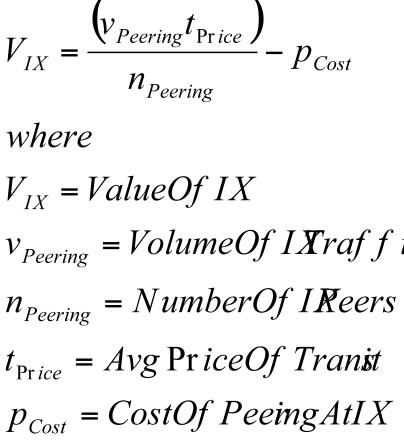
We say ‘peered away for free’, but public peering is not completely free. The cost of public peering includes some monthly recurring costs for each participant at the IX. If we subtract these costs from the value derived, we can estimate the value of the IX to the population:
ValueIX = TrafficPeeredAtIX * TransitPrice – CostOfPeering*NumberOfMembers
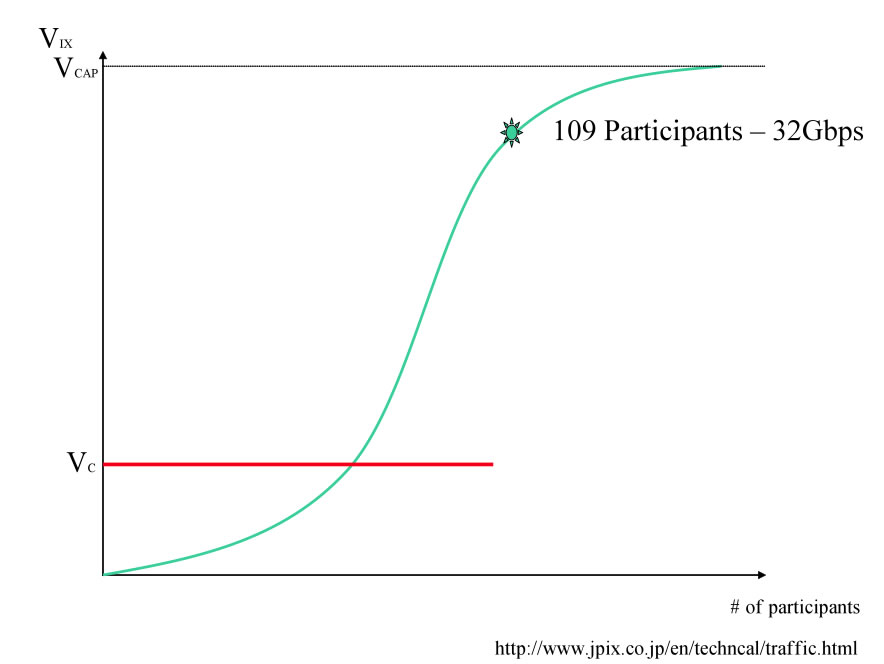
Observation: The Internet Exchange Points exhibit the characteristics of what economists call the “Network Externality Effect”; the value of the product or service is proportional to the number of users of the product or service .
Internet Exchanges are a special case of this effect; the value of an Exchange Point is not the number of participants but a slightly more complex calculation including the number and uniqueness of the routes and volume of traffic peered. Since the value of the IX to an ISP is proportional to the amount of traffic the ISP can exchange in peering relationships at the IX, the value of the IX to the peering population follows the network externality graph as shown below.
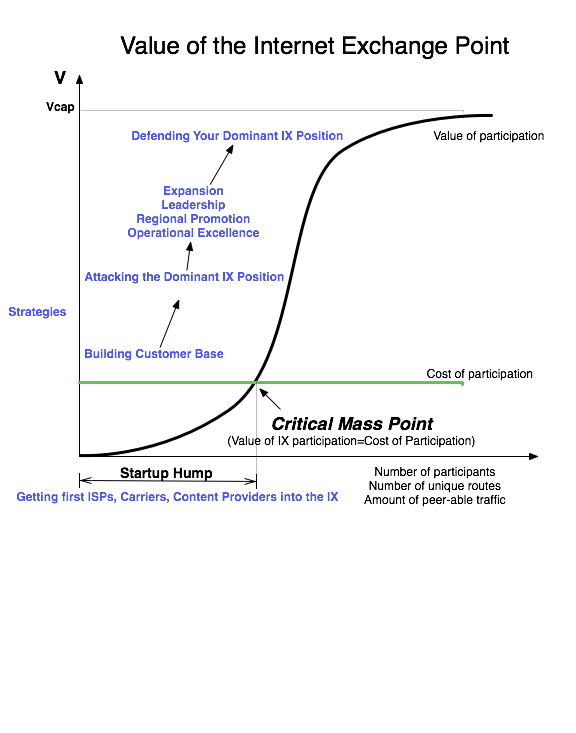
On the Y-axis we see the value of the Internet Exchange Point. On the X-axis we see the independent variable that causes the value of the IX to increase; we will use the number of participants for now; as more participants connect to the exchange for peering, the more value an NSP could derive from peering at the IX
All Internet Exchange Points go through the following growth curve. They start out with zero or a few founding ISP members, and face the challenge of attracting additional peers into a building where there are not many peers to peer with. This is the "startup hump", and solutions to this problem were shared with the author in "The Art of Peering: The IX Playbook".
Once the IX reaches critical mass, where the value of participation exceeds the cost of participation, the a well positioned IX experiences exponential growth.
Note: Some variables in this equation may be difficult to obtain.
Many Internet Exchange Points make the aggregate peering traffic volume available to the public, but some do not.
Further, private peering exchanges often utilize cross connects making it impossible to assess the total amount of traffic traversing their private exchange. This formula is therefore more accurately described as the value of a Public Internet Exchange fabric to the participants. To calculate the value of the Internet exchange, one would need to include not only the public peering fabric, but also the benefits of private peering and buying/selling transit in an environment where interconnection cross connects is less expensive than with local loops.
Be sure to chaeck out the Modeling an Internet Exchange Point for a list of the assumptions in this model.
Now we can estimate the value of the Internet Exchange Point, or at least the value of the public peering that we can measure at the Internet Exchange Point.
This Internet Peering Ecosystem has the following Internet Exchange Points:
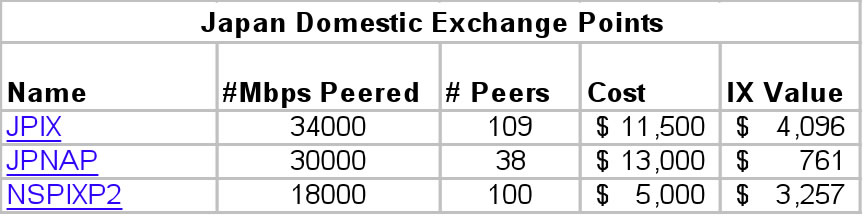
Domestic Peering Points in Japan. Taking a look at the three large public internet exchanges in Japan, we see a relatively high cost of participation, but also a large associated value. For example, at the JPIX, on average a participant saves $4,096 per month by sending peering traffic to the IX as opposed to sending this traffic through an upstream transit provider.
The JPIX Internet Exchange is owned and operated by KDDI, an Tier 1 ISP in Japan.
The non-neutrality of the JPIX has come up as an issue in the past. One example was mailed in: a large content provider ordered a cross connect to Sprint for the purposes of purchasing transit and was denied. Then, 18 months or so later it was placed as a cross connect for the purposes of peering and it was allowed. The ISPs interviewed expressed concern that KDDI interests play a role in the interconnections at the JPIX.
We can see the JPIX value in the IX peering value graph below.
Source: http://www.jpix.co.jp/en/service/price.html
During the research one additional surprise that was that cross connects bypassing the JPIX switch need to be explicitly approved by KDDI. This decision is based on KDDI’s interests and cross connects have been denied to competitors .
Other Japanese Peering Drivers Metro fiber in Tokyo is inexpensive. From NTT to customer building (already on NTT network), one can expect to pay about $300/month US for a fiber loop! There are many dark fiber options available now in metro areas .
Japan is largely a Bi-lateral Peering Agreement environment, and it is reported to be somewhat difficult to get peering without a local (human) presence . Transit prices approach those in the US as commits increase.
In the table below we see that the transit prices in Japan drop dramatically as the level of commit increases. Given these aggressive transit prices, does peering make sense in Japan?
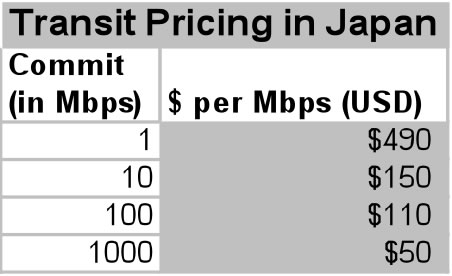
Figure 4 - The Price of Internet Transit in this ecosystem
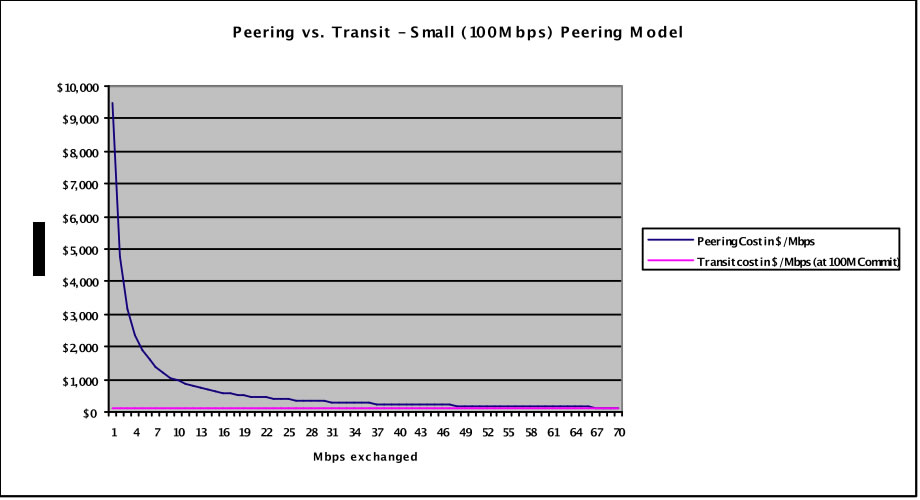
First we will discuss peering using a Fast Ethernet (FastE henceforth) 100Mbps interface at an IX. Ethernet. Ethernet is very efficient but does not provide a full 100Mbps capacity – there are some framing costs that limit the interface to 94% of the 100Mbps. Further, Peering Coordinators understand that when the interface averages 75% utilized, the peaks are probably reaching the capacity of the link. Therefore, we apply the 75% rule against the 94 Mbps to obtain an Effective Peering Bandwidth of 70.5Mbps. Beyond this point, the Peering Coordinator will typically upgrade the peering interconnect.
The business case for peering is tough to make at low peering volumes, mostly due to the cost of local loops and the relatively high cost of IX participation ($9,500 per month including local loop). We see in the analysis below that using a FastE for peering at the JPIX, with only 70.5 Mbps available for peering yields a minimum cost of peering of $134.75 per Mbps. This is the best cost of traffic exchange that the peer can hope for. When compared against transit pricing of $110 per Mbps for a 100Mbps commit, the business case for peering fails. It does not make sense (financially) to peer at the JPIX at FastE speeds.
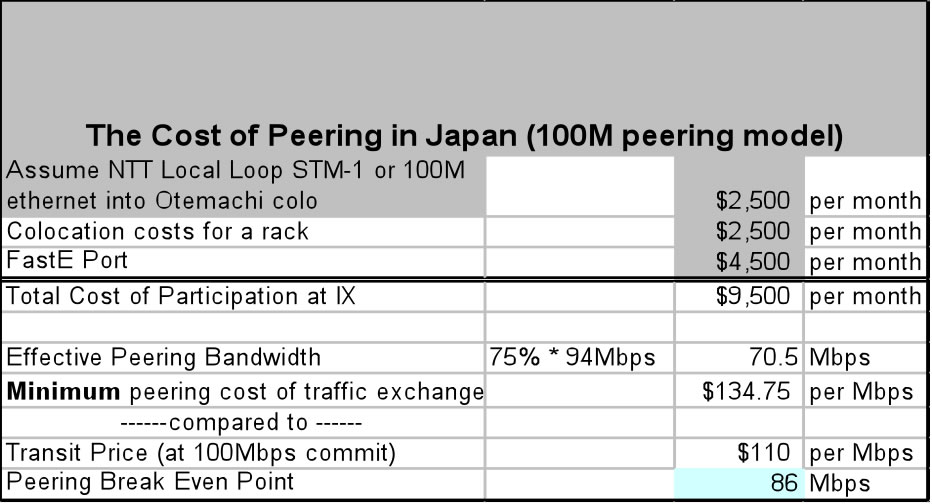
We see in the graph below that the cost of peering is greater than the cost or transit, assuming of course that the full 100Mbps commit on the transit pipe is met and the real unit cost of transit is $110 per Mbps.
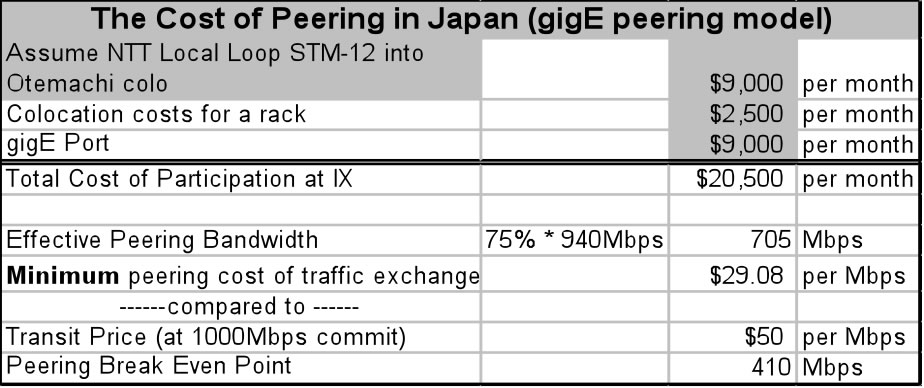
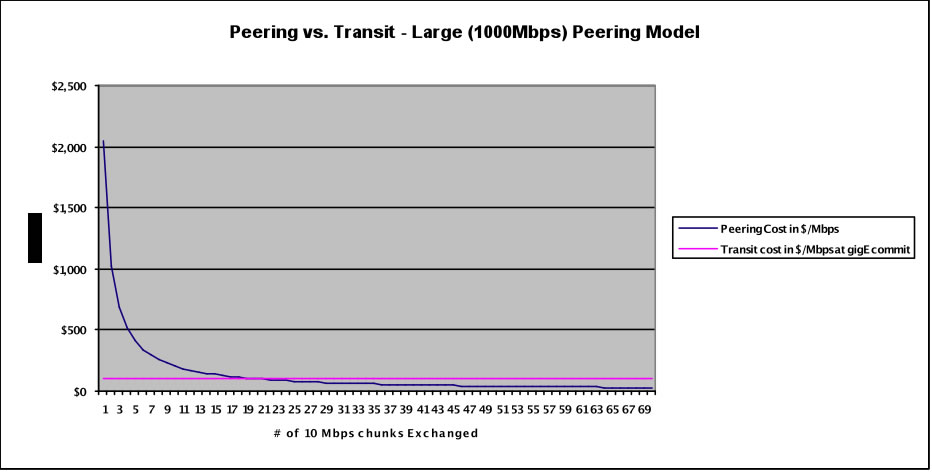
When we consider the larger peering model we fare much better. We assume that an ISP is bringing in a GigE local loop and purchasing a gigE port for peering is probably also buying transit at a gigabit Ethernet commit pricing of $50 per Mbps. While the cost of this larger model peering is substantially more than the previous case (now $20,500 per month), we see a break even point of 410 Mbps, which is substantially below the Effective Peering Bandwidth of 705 Mbps.
Figure 4 - The Price of Internet Transit in this ecosystem
If an ISP can peer at least 410 Mbps then we can prove that it makes sense financially to peer there. This Effective Peering Range, the range between the Peering Breakeven Point and the Effective Peering Bandwidth, shows the “Sweet Spot” for peering at this IX. We can see the breakeven point graphically in the graph below.
DrPeering.net ©2014 | Privacy Policy | Terms and Conditions | About Us | Contact Us
The 2014 Internet Peering Playbook is now available on the iPad at the Apple Store and for the Amazon Kindle. The Kindle, ePub and PDF form are also perpetually updated on the DrPeering DropBox share.