
With the low price of Internet Transit, does Internet Peering still make sense?
This white paper is intended for the Chief Financial Officer with little time; it is intended to directly answer this fundamental and recurring business question in the peering community.
We answer this question with financial proof using real-world numbers from the field.
We demonstrate the "Peering Break Even Analysis Graph," a financial model for the cost of peering as compared with the cost of transit.
Updated September 13, 2010
Over two hundred ISP Peering Coordinators were interviewed over the past decade to determine the processes of and motivations for peering, and chief among the motivations was reducing the cost of “transit”. To describe this motivation in brief let’s first introduce a couple of definitions.
First, the most basic definition is the definition of the Internet Service Provider:
Definition: Internet Service Providers (ISPs) connect end-users and businesses to the public Internet.
By definition therefore, ISPs must somehow themselves connect to the Internet. For most ISPs this means purchasing a service called “Internet Transit” from an ISP that is already attached to the Internet.
Definition: Internet Transit is the business relationship whereby one ISP provides (usually sells) access to all destinations in its routing table .

Figure - Transit Relationship - selling access to the entire Internet.
Internet Transit can be thought of as a pipe in the wall that says "Internet this way".
In the illustration above, the Cyan ISP purchases transit from the Orange Transit Provider (sometimes called the "Upstream ISP"), who announces to the Cyan ISP reachability to the entire Internet (shown as many colored networks to the right of the Transit Providers). At the same time, the Transit Provider propagates the Cyan routes across the Internet so that all attached networks know to send packets to the Cyan ISP through the Orange Transit Provider. In this way, all Internet attachments know how to reach the Cyan ISP, and the Cyan ISP knows how to get to all the Internet routes.
Some Characteristics of Internet Transit
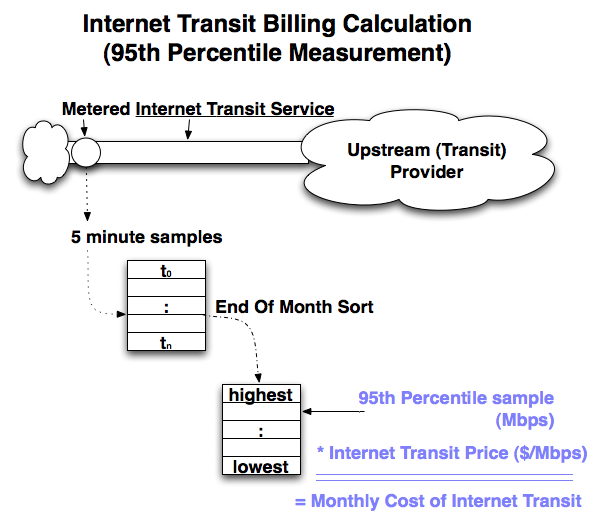
Transit is a simple service from the customer perspective. All one needs to do is pay for the Internet Transit service and all traffic sent to the upstream ISP is delivered to the Internet. The transit provider charges on a metered basis, measured on a per-Megabit-per-second basis using the 95th percentile measurement method.
Transit provides a Customer-Supplier Relationship. Some content providers shared with the author that they prefer a transit service (paying customer) relationship with ISPs for business reasons as well. They argue that they will get better service with a paid relationship than with any free or bartered relationship. They believe that the threat of lost revenue is greater than the threat of terminating a peering arrangement if performance of the interconnection is inadequate.
Transit may have SLAs. Service Level Agreement and rigorous contracts with financial penalties for failure to meet service levels may feel comforting but are widely dismissed by the ISPs that we spoke with as merely insurance policies. The ISPs said that it is common practice to simply price the service higher with SLAs, with increased pricing proportional to the liklihood of their failure to meet these requirements. Then the customer has to notice, file for the SLA credits, and check to see that they are indeed applied. There are many ways for SLAs to simply increase margins for the ISPs without needing to improve the service.
Transit Commits and Discounts. Upstream ISPs often provide volume discounts based on negotiated commit levels. Thus, if you commit to 10Gigabits-per-second of transit per month, you will likely get a better unit price than if you commit to only 1gigabit-per-second of transit per month. However, you are on the hook for (at least) the commit level worth of transit regardless of how much traffic you send.
Transit is a commodity. There is debate within the community on the differences between transit from a low cost provider and the Internet transit service delivered from a higher priced provider. The higher price providers argure that they have better quality equipment (routers vs. switches)
Transit is a metered Service. The more you send or receive, the more you pay. (There are other models such as all-you-can-eat, flat monthly rate plans, unmetered with bandwidth caps, etc. but at the scale of networking where Internet Peering makes sense the Internet Transit services are metered.)
The metered rate for the Internet transit service varies widely, but the service itself is typically metered and charged based upon a 95th percentile traffic sampling technique.
Definition: 95th Percentile Measurement is used to determine the volume of traffic exchanged for the transit fee (or paid peering) calculation.
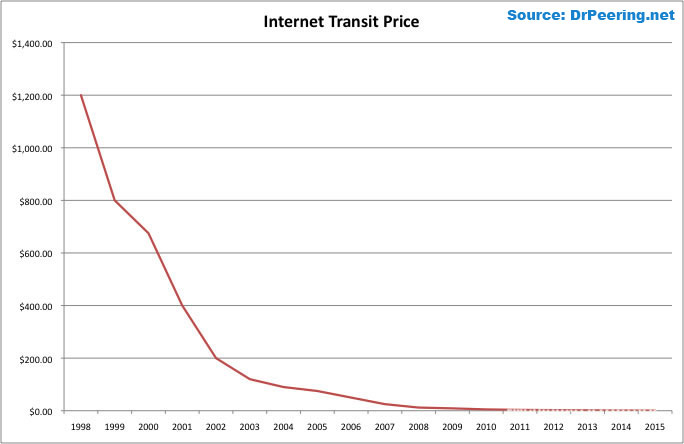
Transit prices are often discounted based on volume commitments and tend to be highly negotiable. Further, the prices have historically dropped significantly over time as shown in the table and graph below.
| Year | Internet Transit Prices (in Mbps, min commit) | % Decline | |
|---|---|---|---|
1998 |
$1200 |
per Mbps | |
| 1999 | $800 |
per Mbps | 33% |
| 2000 | $675 |
per Mbps | 16% |
| 2001 | $400 |
per Mbps | 40% |
| 2002 | $200 |
per Mbps | 50% |
| 2003 | $120 |
per Mbps | 40% |
| 2004 | $90 |
per Mbps | 25% |
| 2005 | $75 |
per Mbps | 17% |
| 2006 | $50 |
per Mbps | 33% |
| 2007 | $25 |
per Mbps | 50% |
| 2008 | $12 |
per Mbps | 52% |
| 2009 | $9.00 |
per Mbps | 25% |
| 2010 | $5.00 |
per Mbps | 44% |
| 2011 | $3.25 |
per Mbps | 35% |
| 2012 | $2.34 |
per Mbps | 28% |
| 2013 | $1.57 |
per Mbps | 33% |
| 2014 | $0.94 |
per Mbps | 40% |
| 2015 | $0.63 |
per Mbps | 33% |
| Source: DrPeering.net | |||
Shown as a graph, the trend is unmistakable - transit prices have always dropped.
U.S Internet Region
The good news for ISPs is that Internet traffic volumes have always grown.
The volume of Internet traffic an ISP sends and receives has historically increased as well, and all indications are that this trend continues today. Even though the price of transit has declined by an average of about 30% per year, the Internet traffic typically increases by at least 50% per year. As customers expand their use of innovative and high-bandwidth services such as streaming and download of video broadcasts, and as large volume music download services go viral, ISPs carry much more traffic and see drastically increased transit fees. To manage this, large scale Internet Service Providers and Content Distributors measure their transit traffic flows to determine where their transit traffic is ultimately delivered.
Definition: Internet Peering is the business relationship whereby companies reciprocally provide access to each others’ customers.
This definition applies equally to Internet Service Providers (ISPs), Content Distribution Networks (CDNs), and Large Scale Network Savvy Content Providers.
To illustrate peering, considerthe figure below showing a much simplified Internet; an Internet with only three ISPs: WestNet, MidNet, and EastNet.
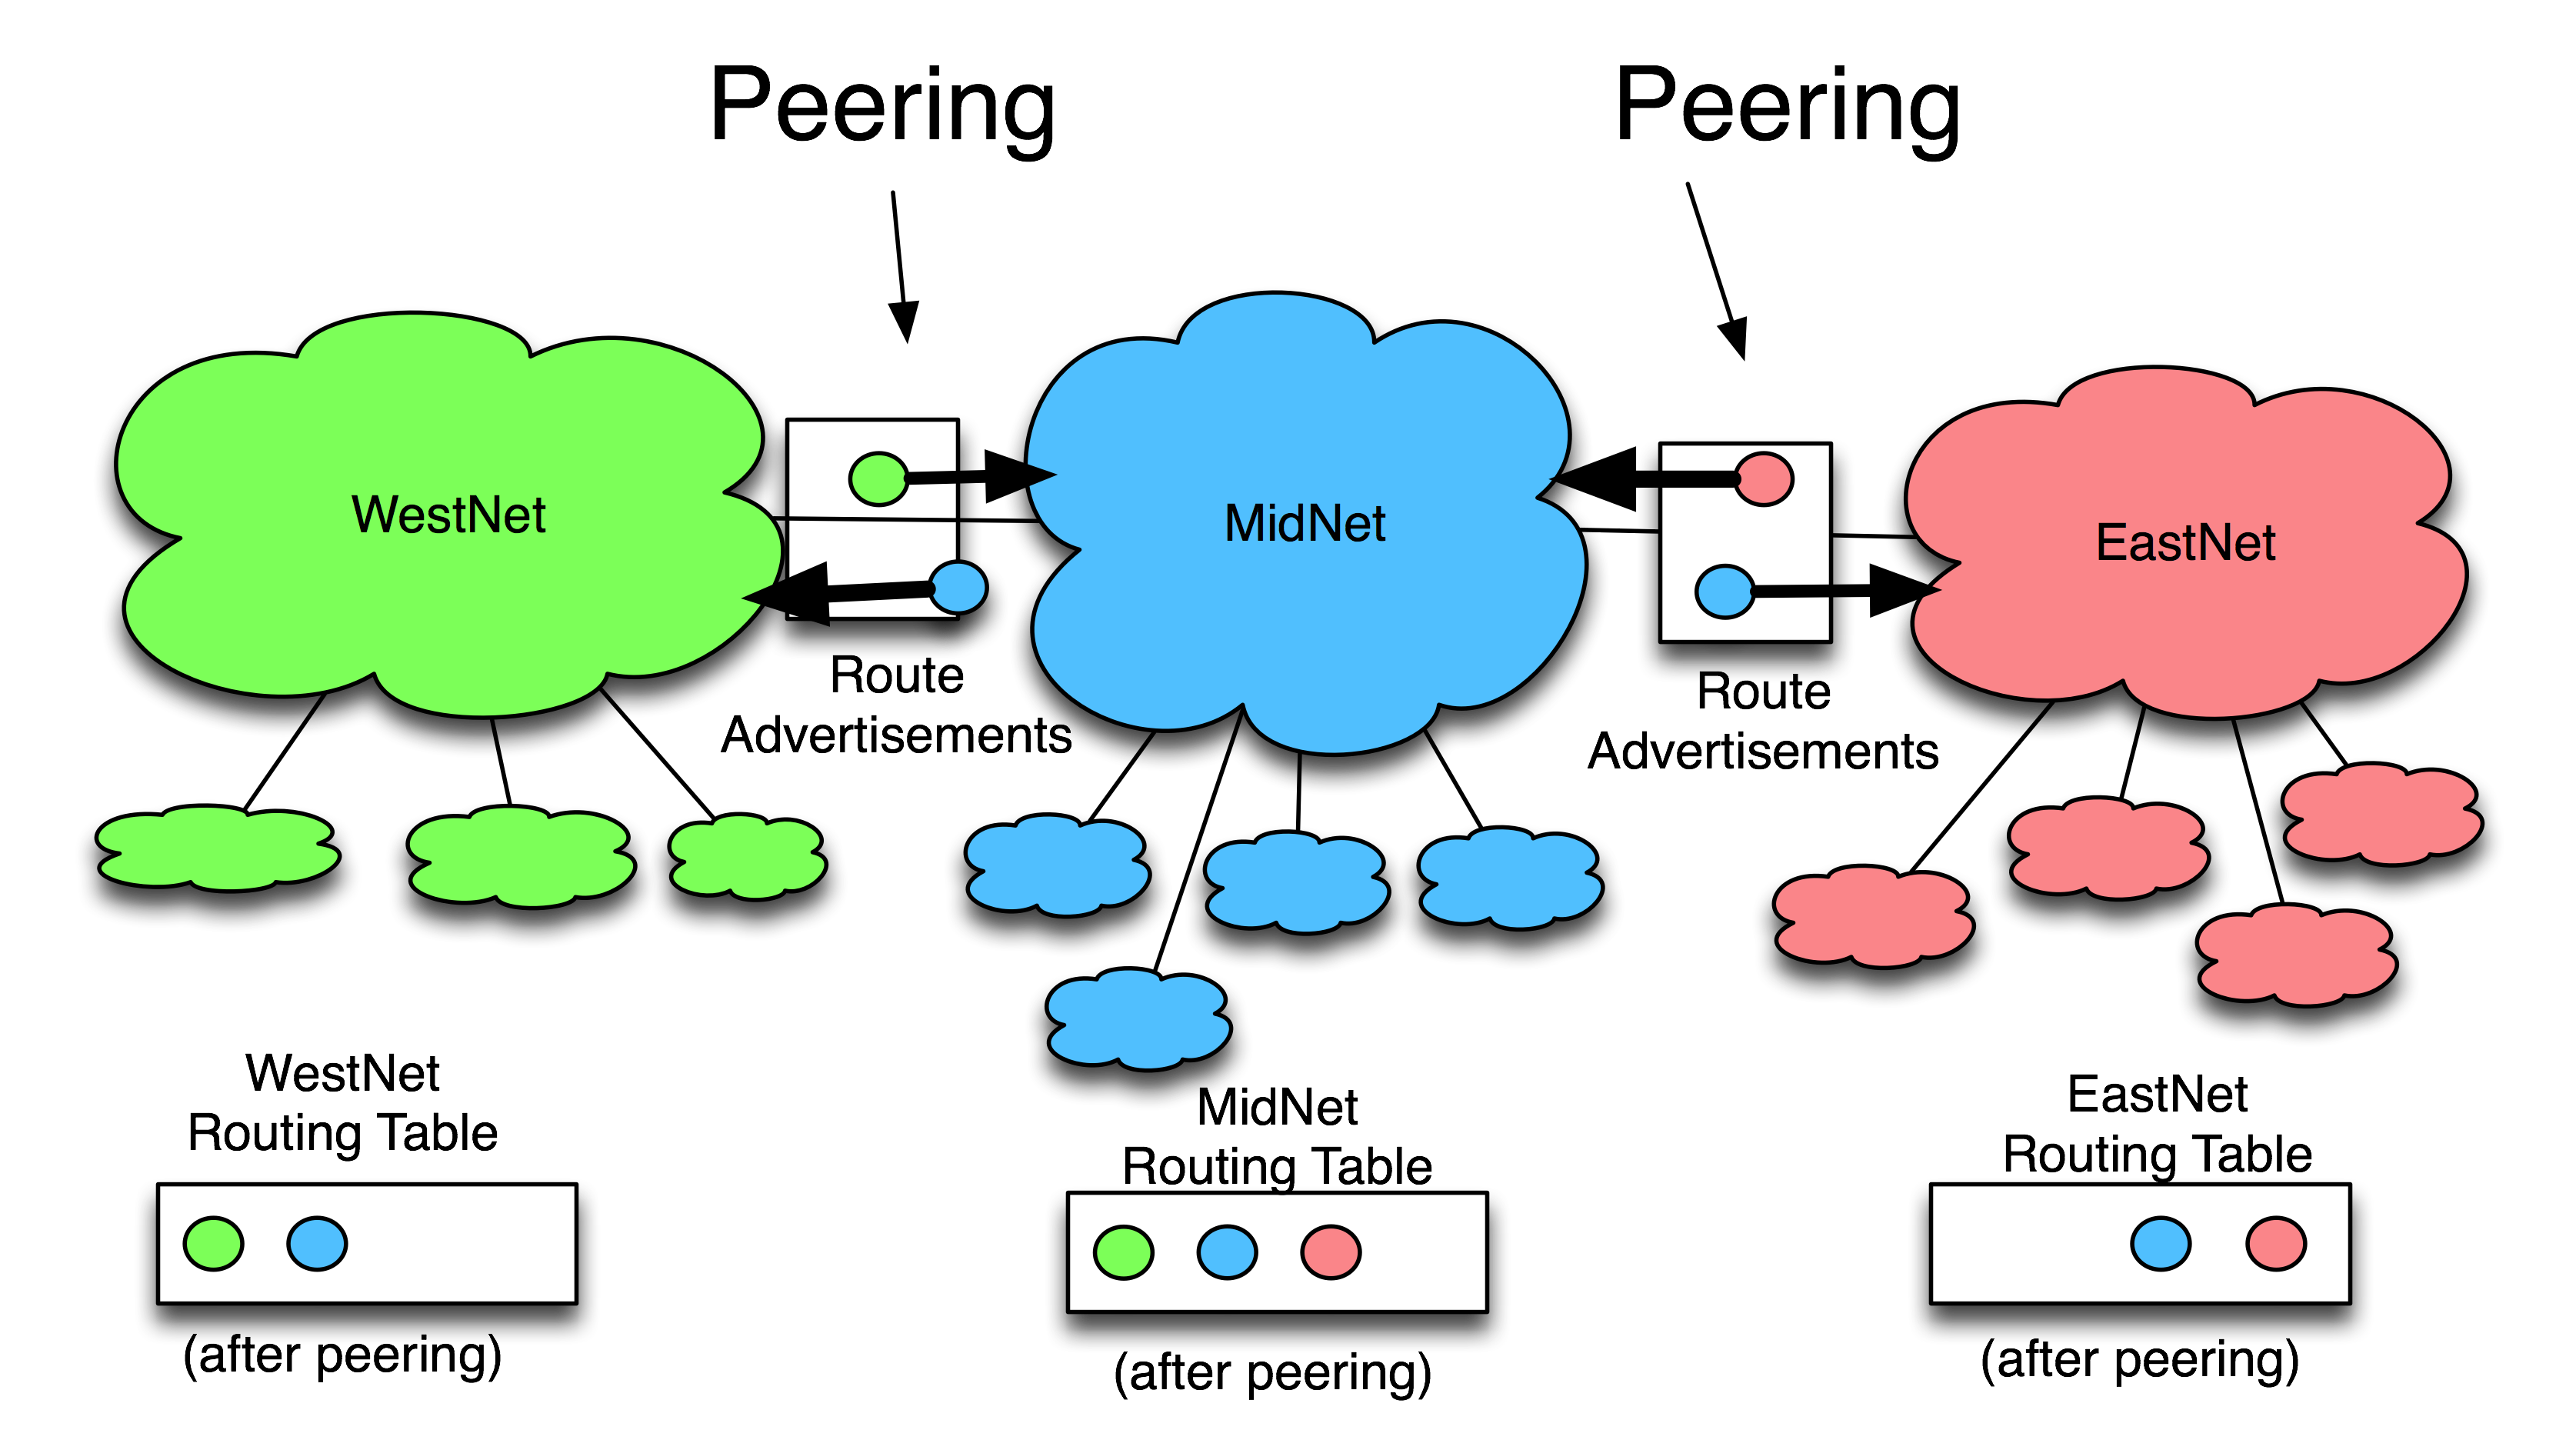
WestNet is an ISP with green customers, MidNet is an ISP with blue customers, and EastNet is an ISP with red customers.
WestNet is in a Peering relationship with MidNet whereby WestNet learns how to reach MidNet's blue customers, and MidNet reciprocally learns how to reach WestNet's green customers.
EastNet is in a Peering relationship with MidNet whereby EastNet learns how to reach MidNet's blue customers, and MidNet reciprocally learns how to reach EastNet's red customers.
Peering is typically a free arrangement, with each side deriving about the same value from the reciprocally arrangement. If there is not equal value, sometime one party of the other pushes for a Paid Peering relationship.
Important as well is that peering is not a transitive relationship. WestNet peering with MidNet and EastNet peering with MidNet does not mean EastNet customers can reach WestNet customers. WestNet only knows how to get to blue and green customers, and EastNet knows how to reach only blue and red customers. The fact that they both peer with MidNet is inconsequential; peering is a non-transitive relationship.
"Peering is a Local Optimization" -- Bill Woodcock
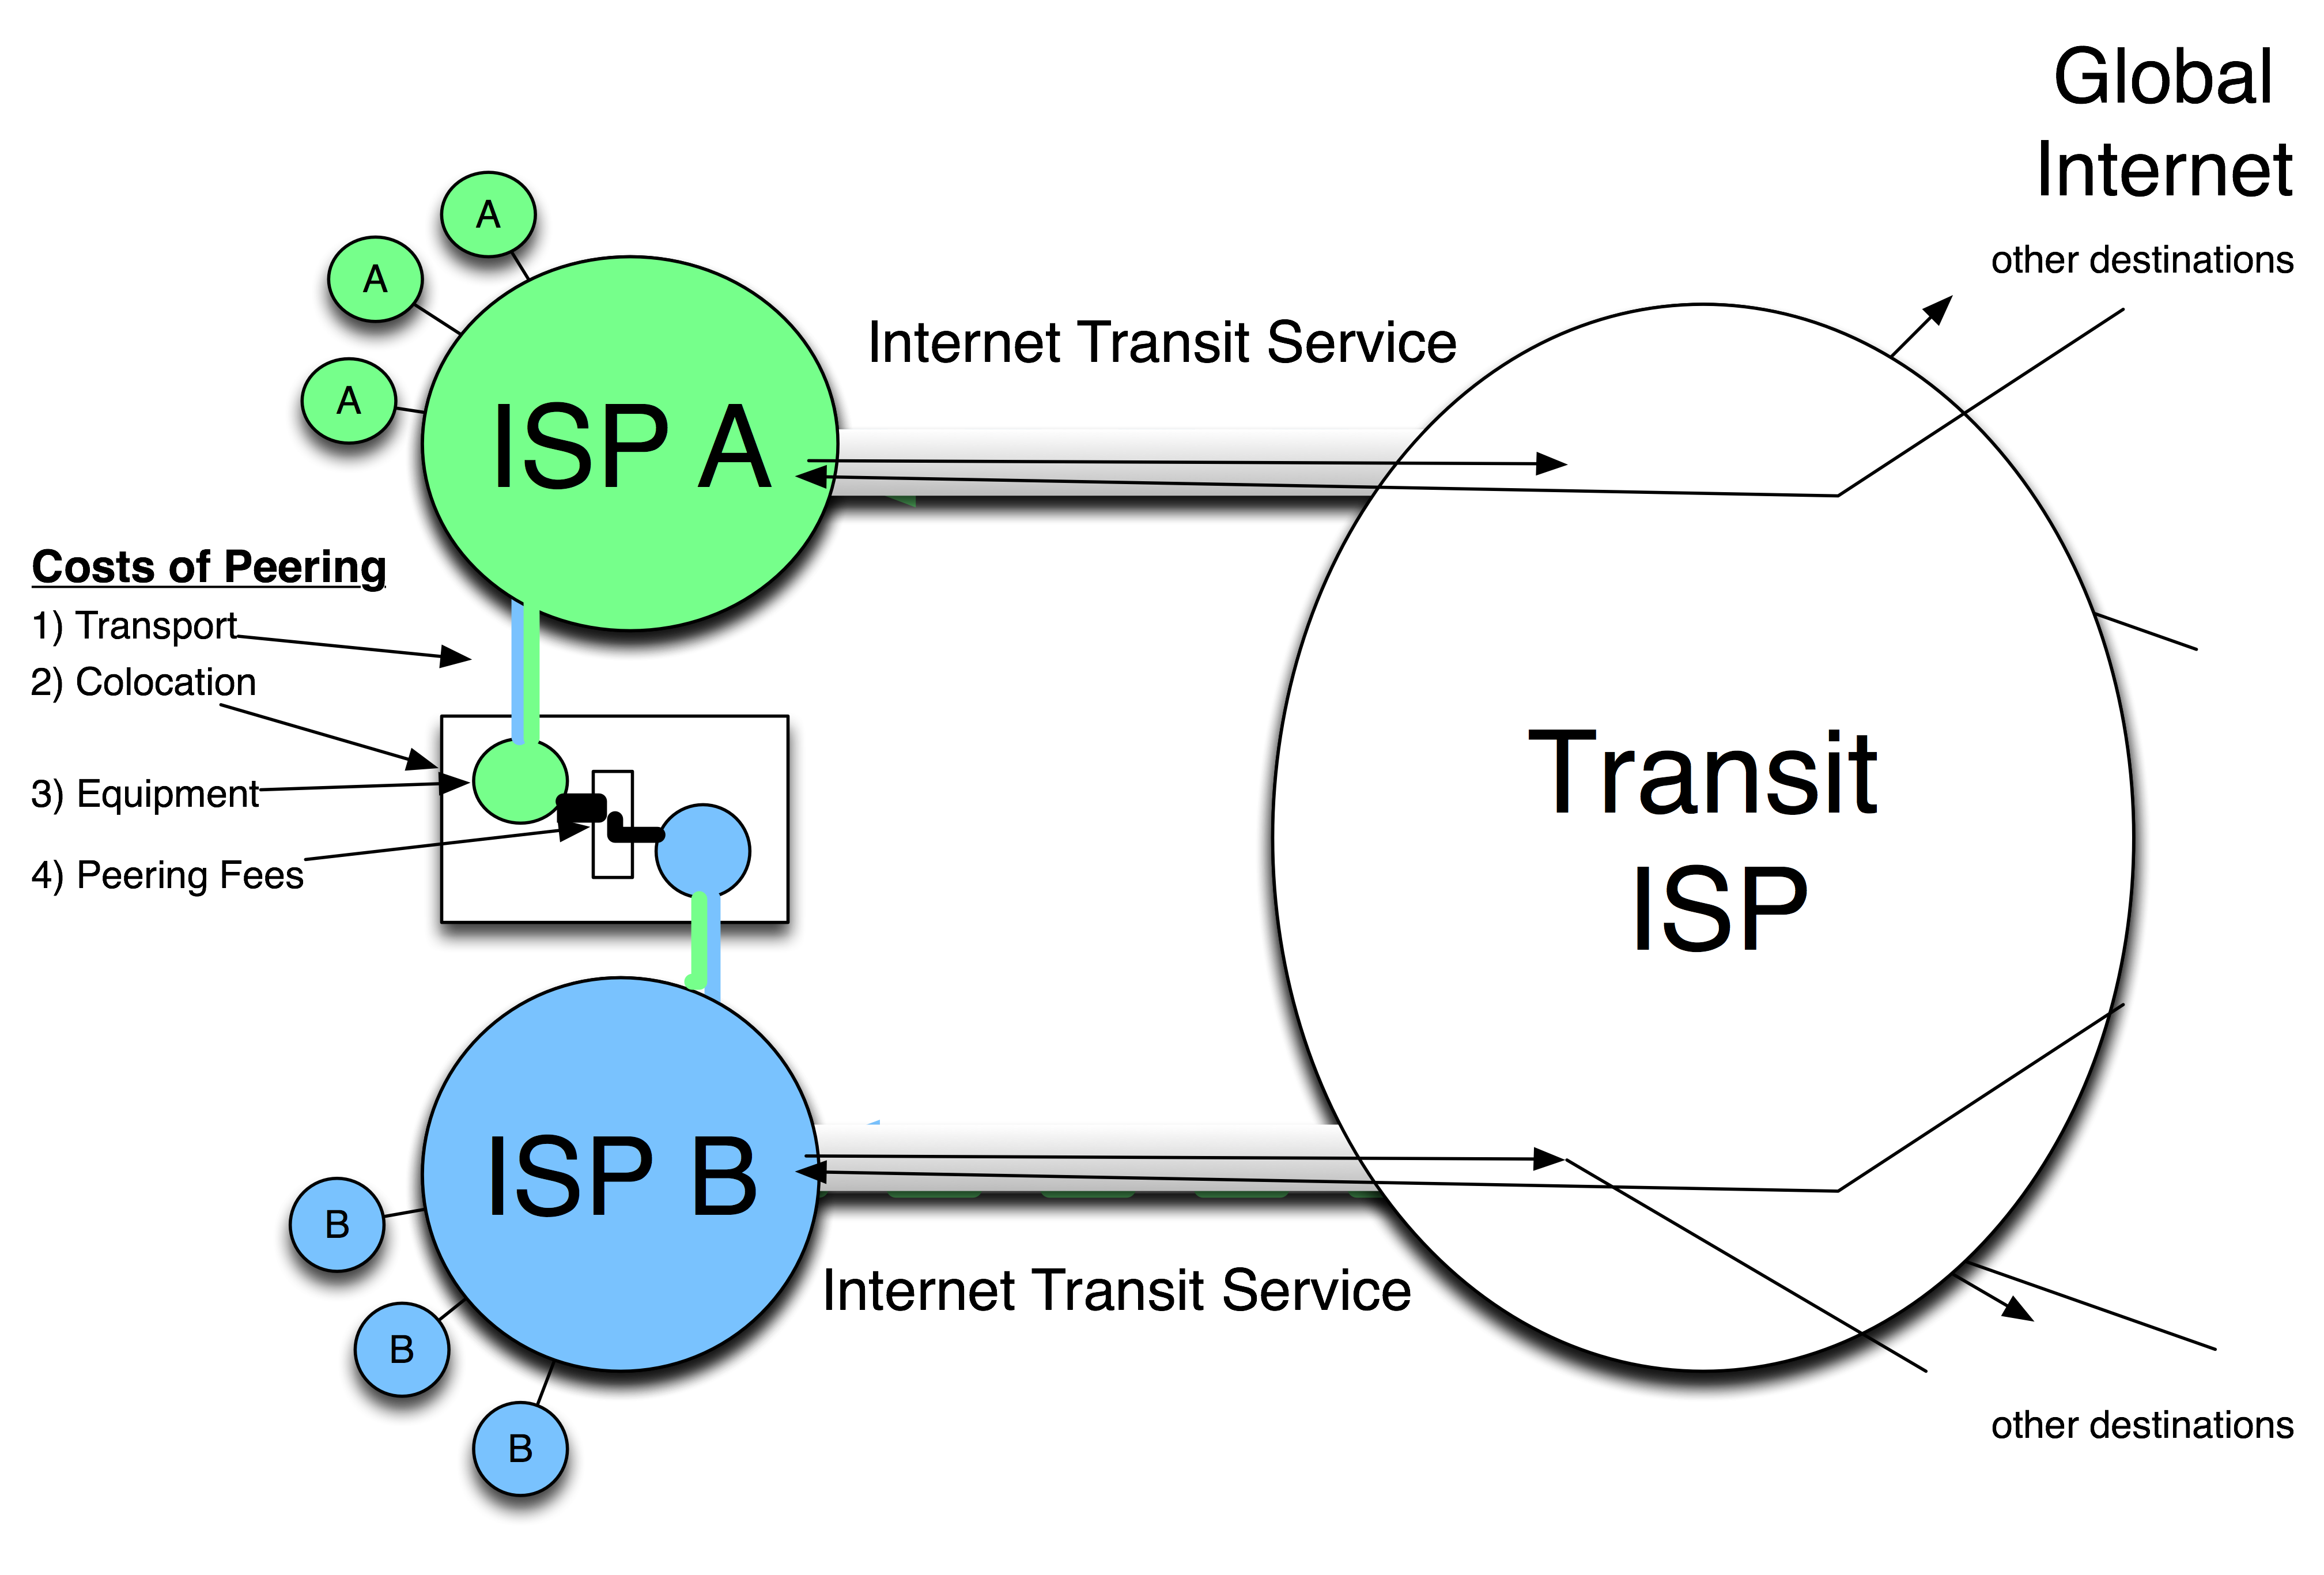
I believe Bill Woodcock coined this phrase, referring to the network engineering practice of "keeping local traffic local", sending it across town instead of shipping it to an upstream ISP to be exchanged somewhere else. Internet Service Providers determine where their traffic is going to and coming from, and identify which target peers would also benefit from peering the traffic local and bypassing the metered transit service.
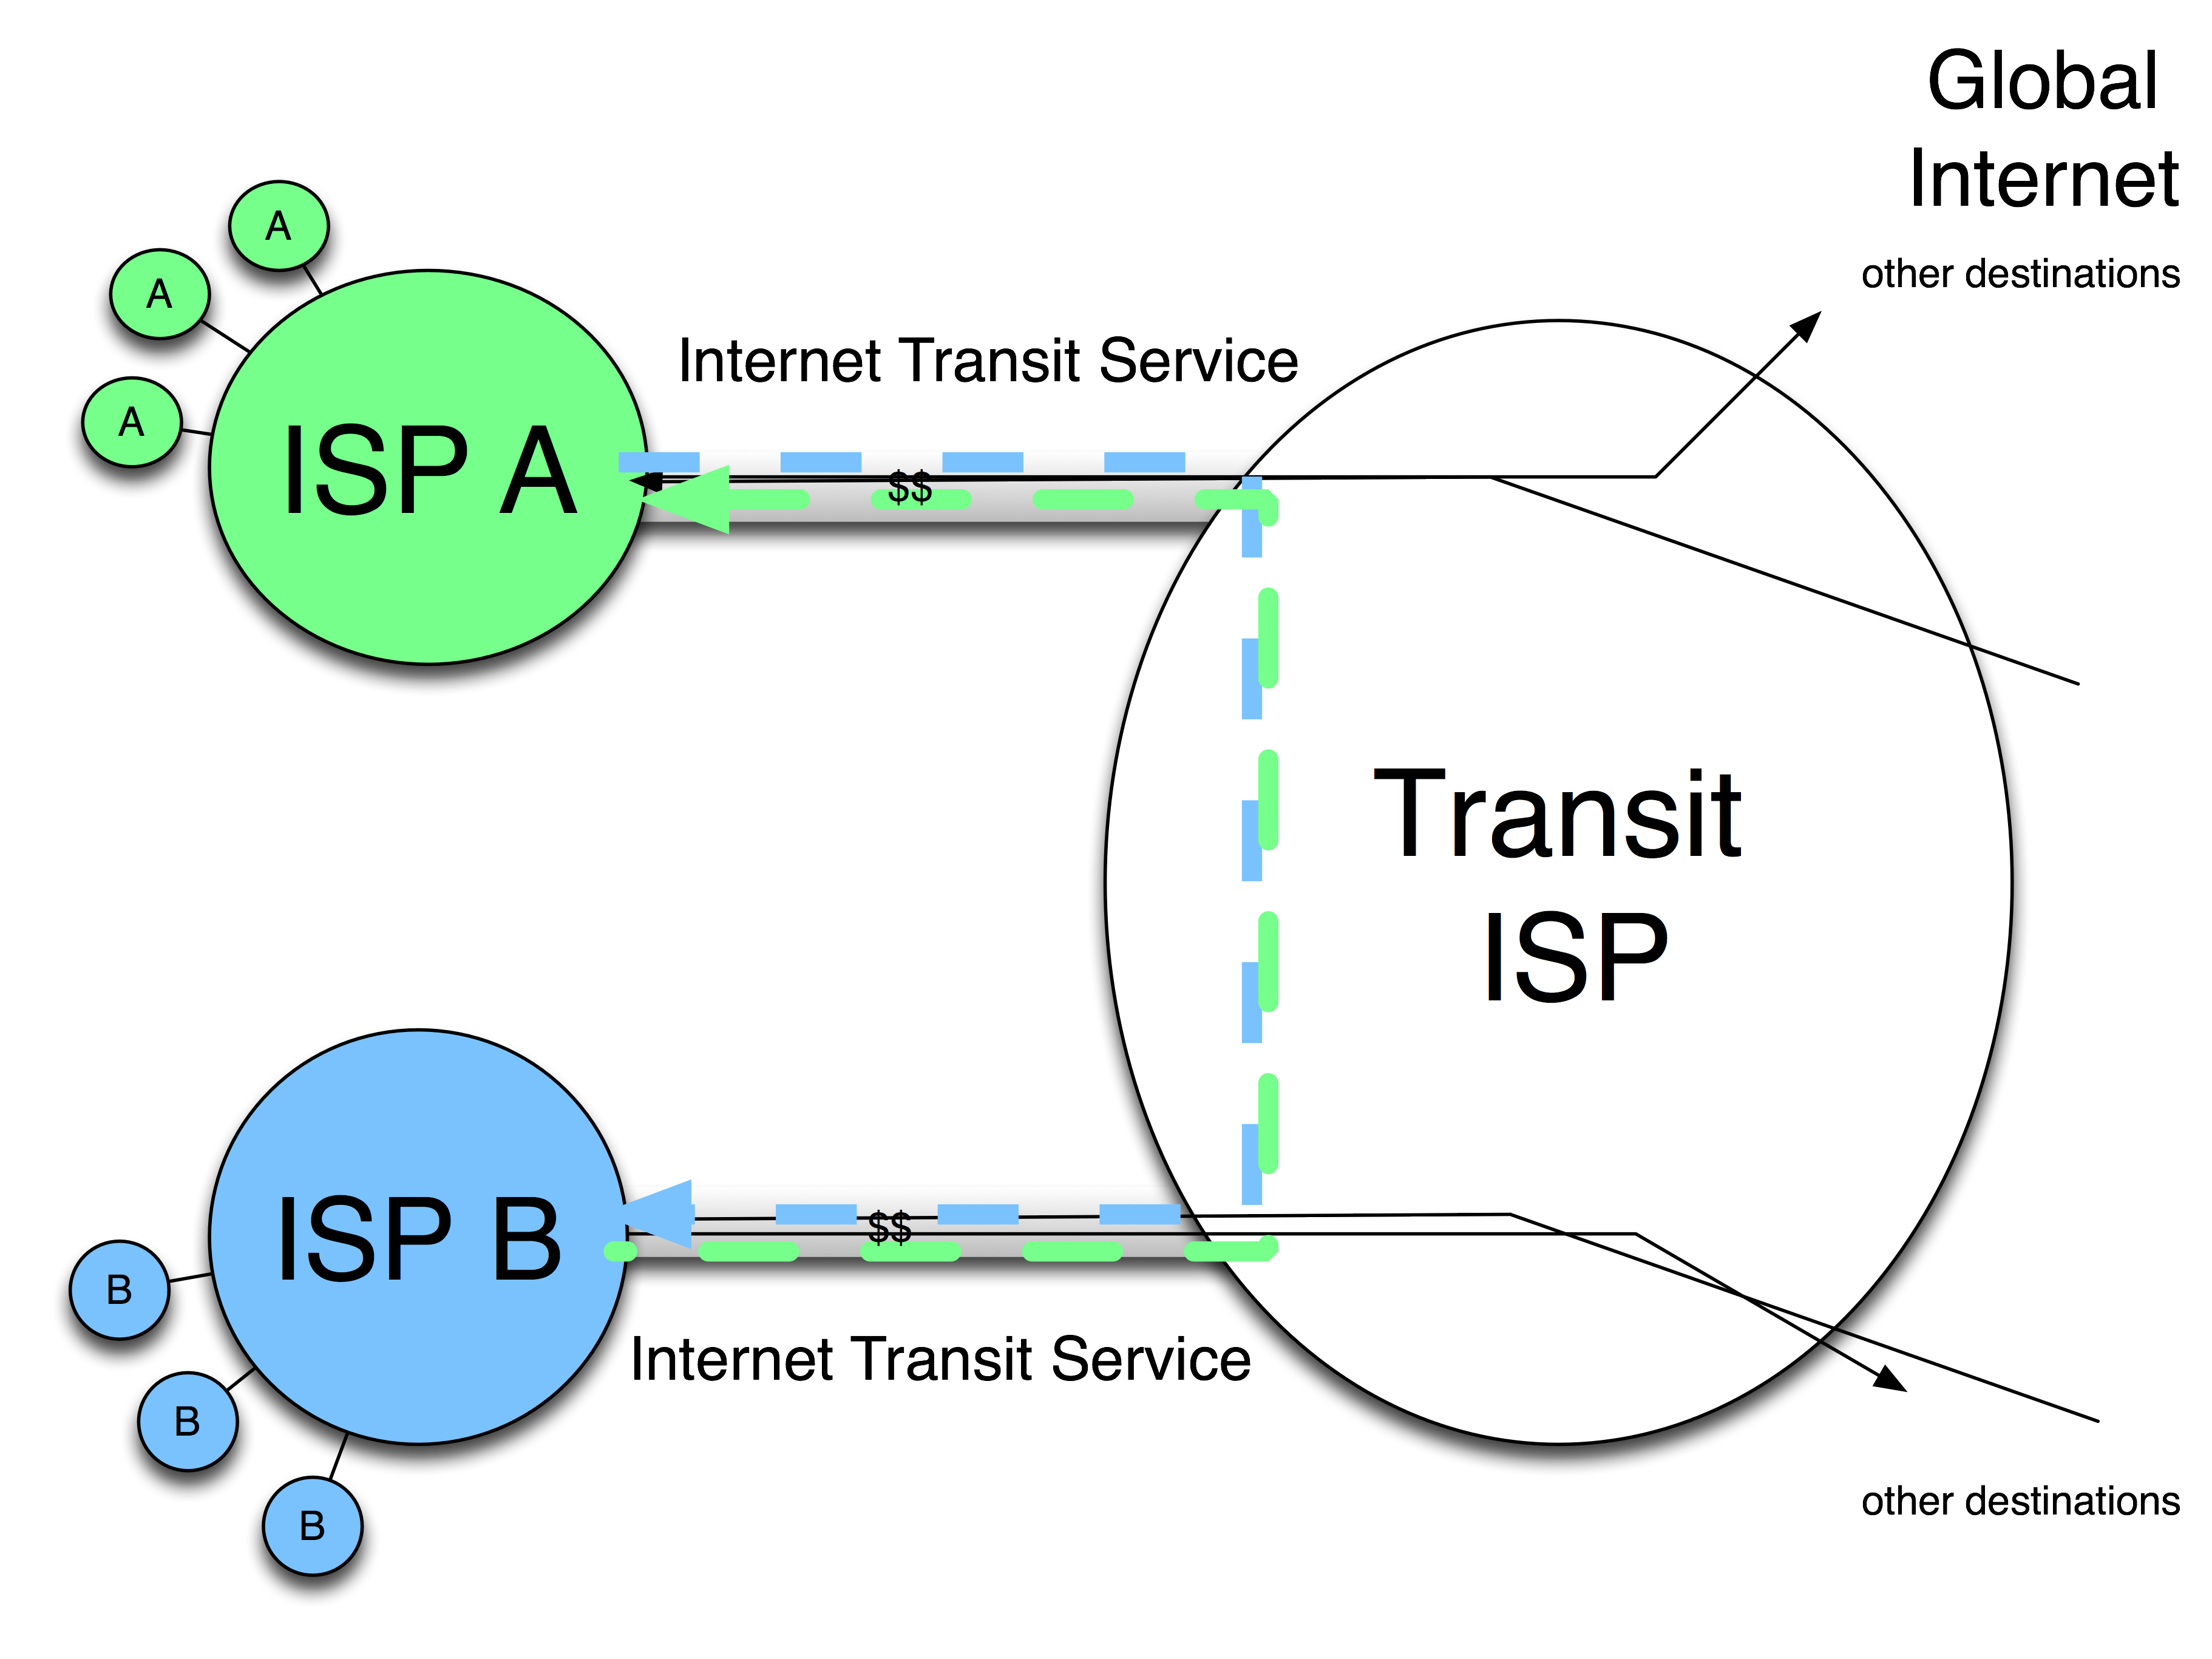
For example, in the graphic below, ISP A might identify ISP B as having customers that access its customers' content, and ISP B has customers that are downloading ISP A customers content. Since both parties send this traffic over a metered transit service, ISP B might be interested in a direct interconnection as well.
Before Peering
So they seek a direct interconnection, and we will assume for this analysis that this is accomplished by colocation at an Internet Exchange Point.
After Peering
Once the top traffic destinations are identified and associated with specific ISPs, these ISPs are targeted for potential peering relationship discussions. Below is a "Peering Top 50 list" in the form of a downloadable spreadsheet that can be used to document large volume peering prospects.
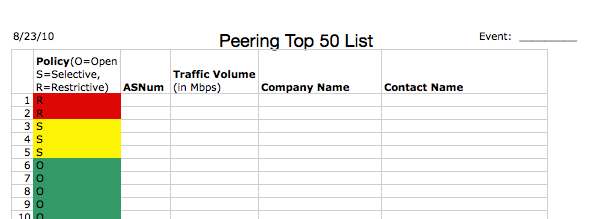
Often the top traffic destinations have a restrictive peering policy and are unlikely to be interested in peering. These restrictive peers are highlighted in red in the spreadsheet.
Prescription: do not waste a lot of time trying to convince the regional Tier 1 ISPs (AT&T, Sprint, Verizon, etc. in the U.S.) to peer with you in the U.S.!
Those that do remain however are potential peering targets. Peering coordinators add up the so-called "peerable" traffic exchanged with these companies to determine how much traffic they might be freely peer. Collectively these ISPs are targeted as ideal candidates for a peering relationship.
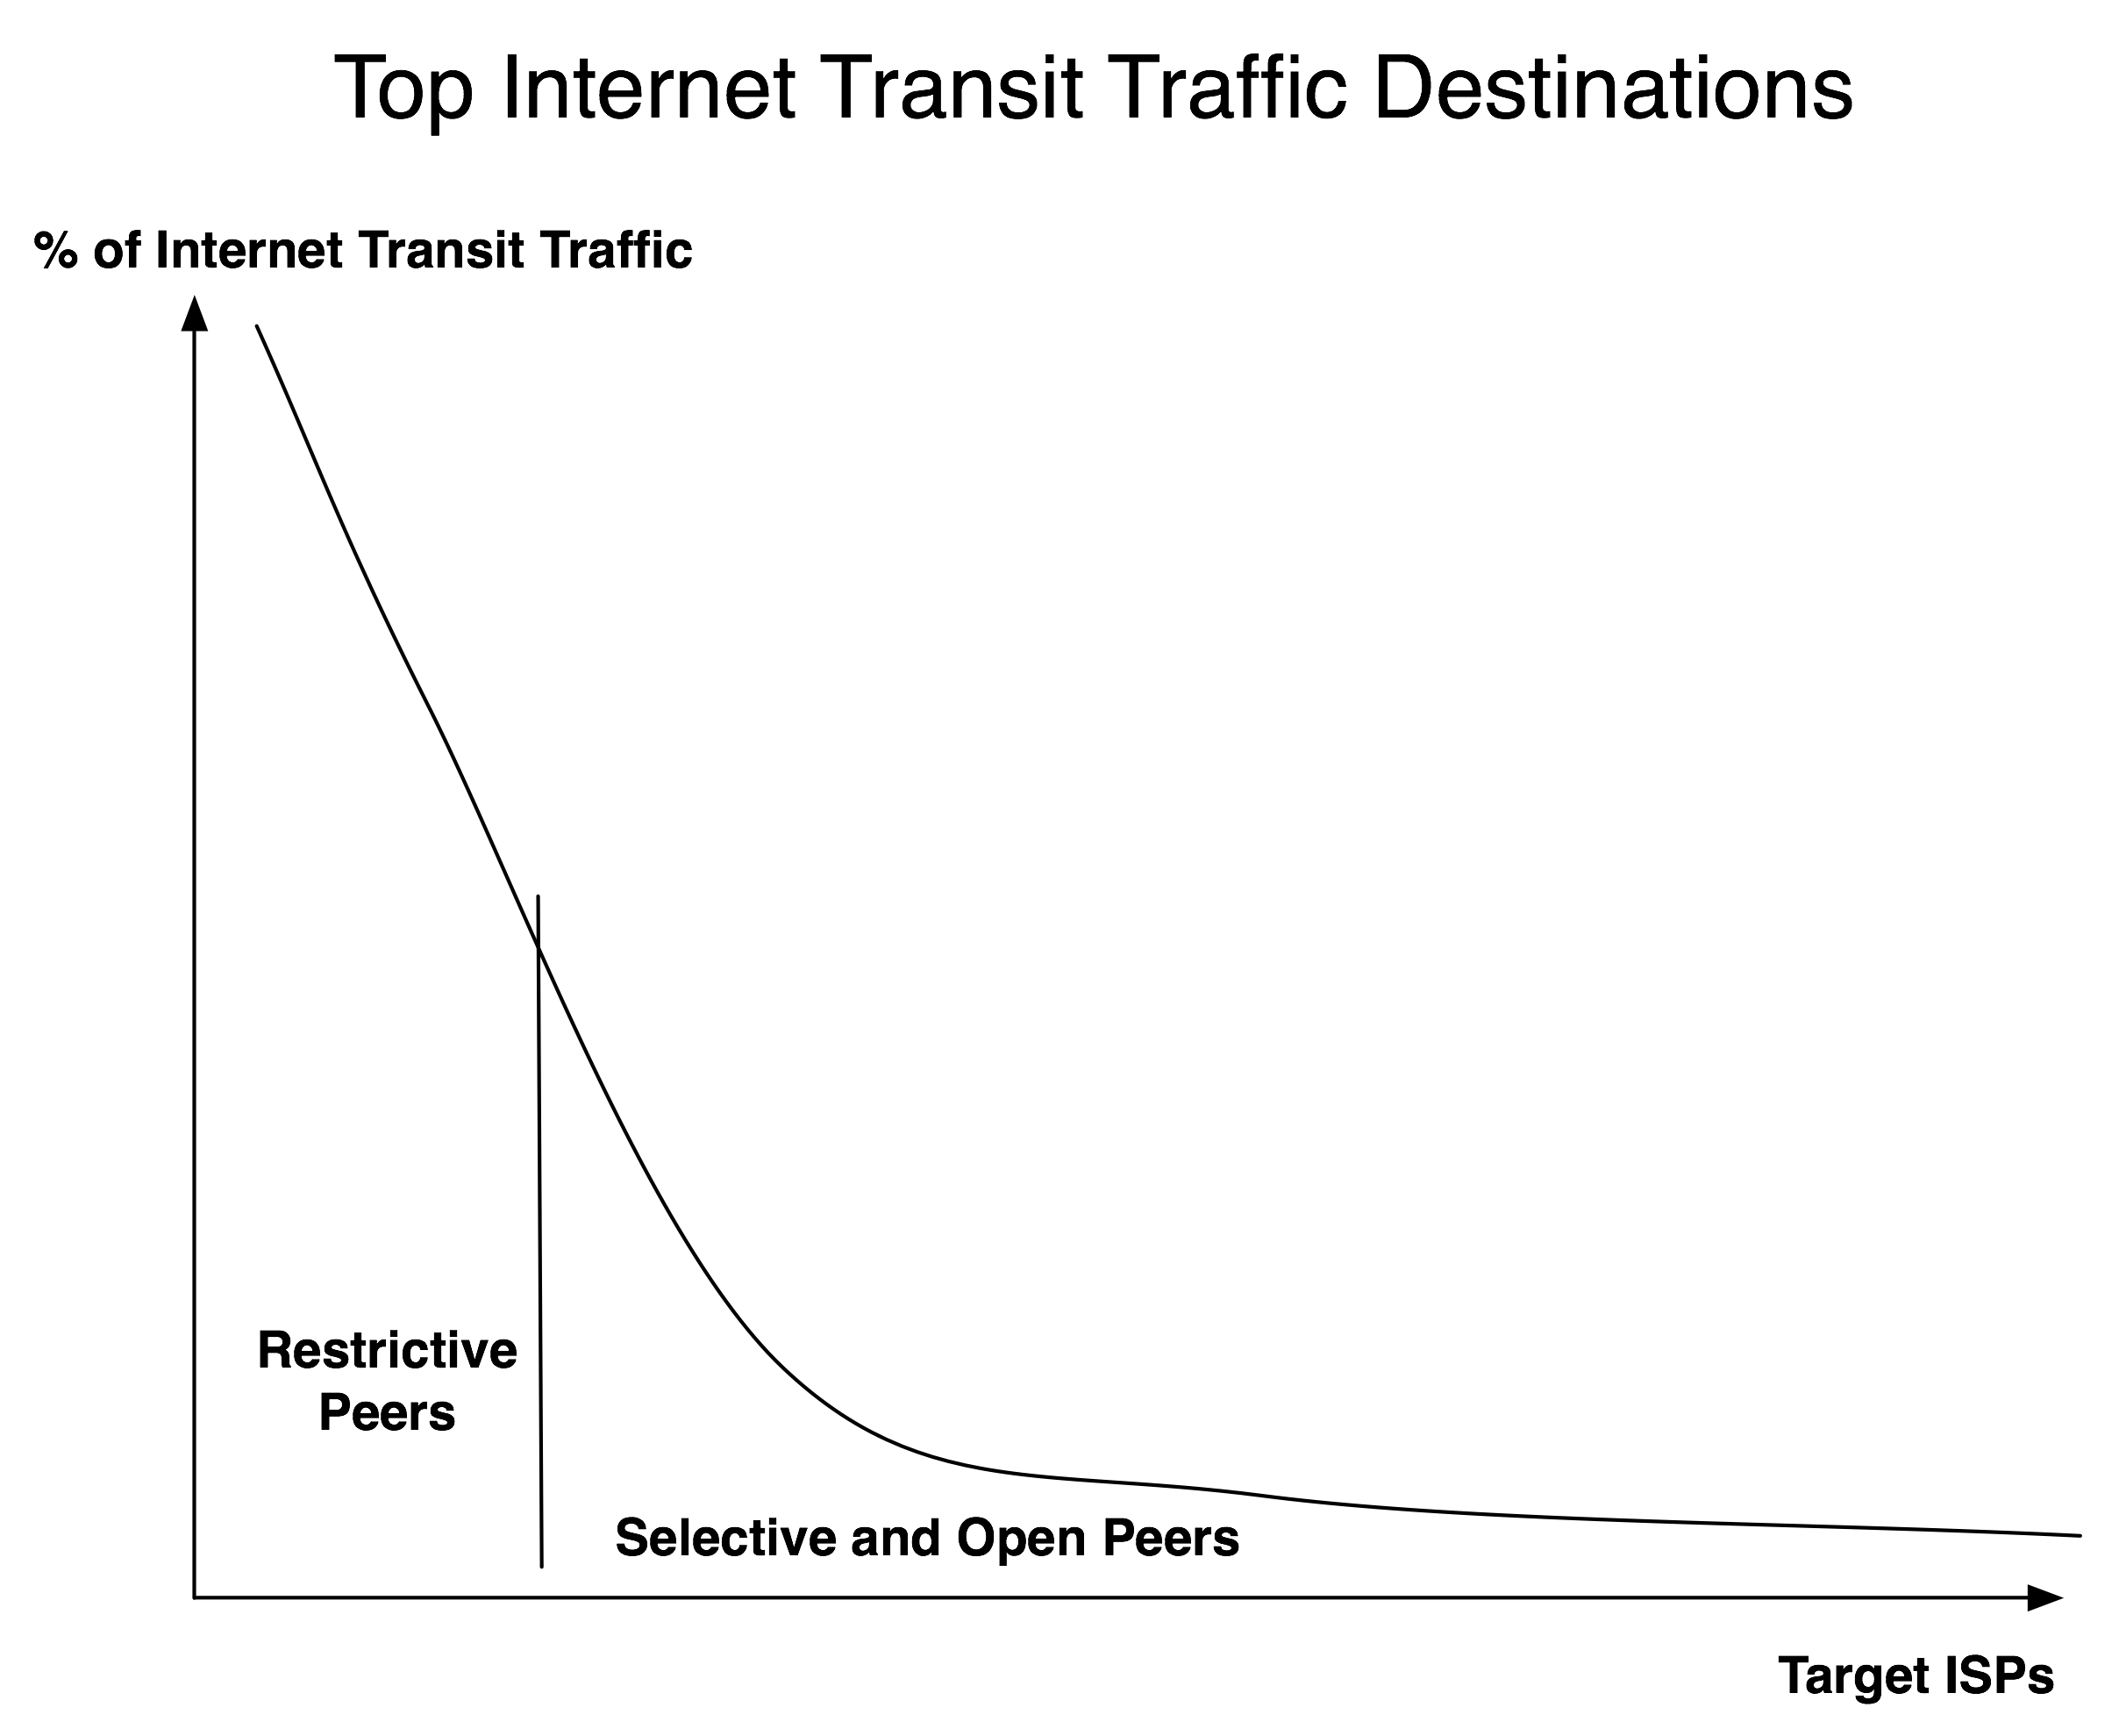
A typical peering destination histogram looks something like the graph below, with the top targets being restrictive peers and representing a large chunk of traffic. The remainder of the traffic is potentially peerable.
For this paper we will model the most common peering approach: public peering at an exchange point using a shared switch fabric .
The cost of peering at an Internet Exchange Point usually involves the following cost components:

Figure 7 - Components of the Public Peering Cost Model
Definition: Transport refers to a physical/data link layer media interconnection (e.g. circuits, gigE switching fabric, gigE over fiber cross connects).
Unlike transit service, transport is typically not metered. Transport is sold as a fixed capacity circuit that costs the same regardless of the amount of traffic exchanged over it.
Likewise, colocation fees, monthly amortized equipment costs and peering port fees are typically the same monthly recurring cost regardless of the amount of traffic that is exchanged over the infrastructure.
Traffic exchanged over a peering relationship itself is typically free. Both peers mutually benefit from the interconnection so neither party charges the other for the peering relationship. Both parties can then send and receive as much traffic as can fit across the transport circuit and peering fabric for the cost of the interconnection.
Answer: When is it less expensive to send traffic over a Peering Interconnection, as compared with simply sending all traffic to Upstream ISP(s) in a Transit relationship(s).
In order to compare Peering and Transit we need to normalize peering costs into the same terms as transit costs ; we need to compare both Peering and Transit on a per-megabit-per-second basis.
To illustrate, let's apply some market price points based on 2010 pricing model for peering costs.
Transport Cost Data Points. At the DE-CIX 2010 meeting, Edward Punt (KPN) and Sven Engelhardt (TiNet) shared with the author that the costs for 10G transport circuits into an IX tend to cost
A specific data point came from a Slovenia ISP who said during Peering Personals that the 10G circuit from Slovenia into the DE-CIX in Frankfurt was quoted as high as $7000 per month, and that from Budapest to the DE-CIX was about $6000 per month.
Let's assume one can purchase a 10 Gigabit transport circuit into an Internet Exchange Point for $6,000/month. At the Internet Exchange Point, let's assume there is a 10G port for $2,000 per month and a powered half rack for $1000/month as pictured in the figure below. We will throw some equipment costs into the mix as well; perhaps a Juniper 320 will amortize to $8,000 per month.
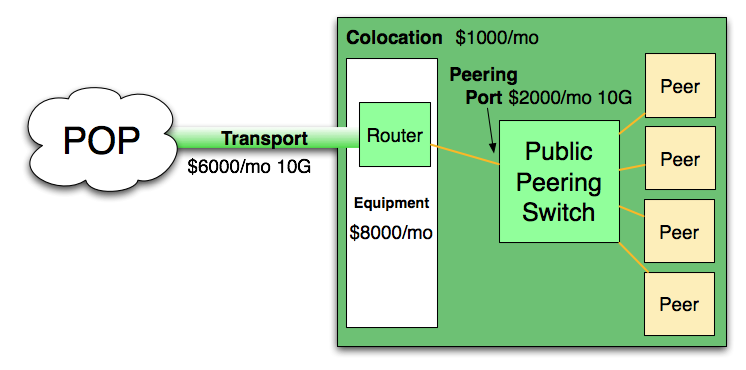
Sample Costs of Internet Peering - Source: Discussions at the DE-CIX Meeting Sept 2010
With all of these costs taken into account, we see a monthly cost of peering from afar of $17,000 per month as shown below.
Peering Costs assumptions
Question: What happens if we peer only 100Mbps on peering infrastructure capable of handling 10G?
Answer: We see in the table below that the cost of peering will work out to be $170 per Mbps when 100Mbps is peered.
| Mbps Exchanged | Peering Cost | |
| 100 | $170.00 | per Mbps |
| 200 | $85.00 | per Mbps |
| 300 | $56.67 | per Mbps |
| 400 | $42.50 | per Mbps |
| 500 | $34.00 | per Mbps |
| 600 | $28.33 | per Mbps |
| 700 | $24.29 | per Mbps |
| 800 | $21.25 | per Mbps |
| 900 | $18.89 | per Mbps |
| 1000 | $17.00 | per Mbps |
Peering Costs allocated over Traffic Volume
As we peer more and more traffic we also see that the unit cost effectively drops. The more traffic we can peer for free over this infrastructure, the lower the average cost of traffic delivery. Effectively, the unit cost per Mbps of traffic exchanged will vary based upon how many Mbps are exchanged at the peering point using this infrastructure.
The analysis so far leads to four key peering metrics for determining when peering makes sense from a purely financial perspective.
If we continue plotting the cost per Mbps across the size of the peering bandwidth we get the Peering Break Even graph as shown below. We are also highlighting the alternative means of offloading that same traffic, which is simply sending that traffic to a transit provider at a known metered rate (Transit Price).
Definition: The Peering Break Even Point is the point where the unit cost of peering exactly equals the unit cost for transit.
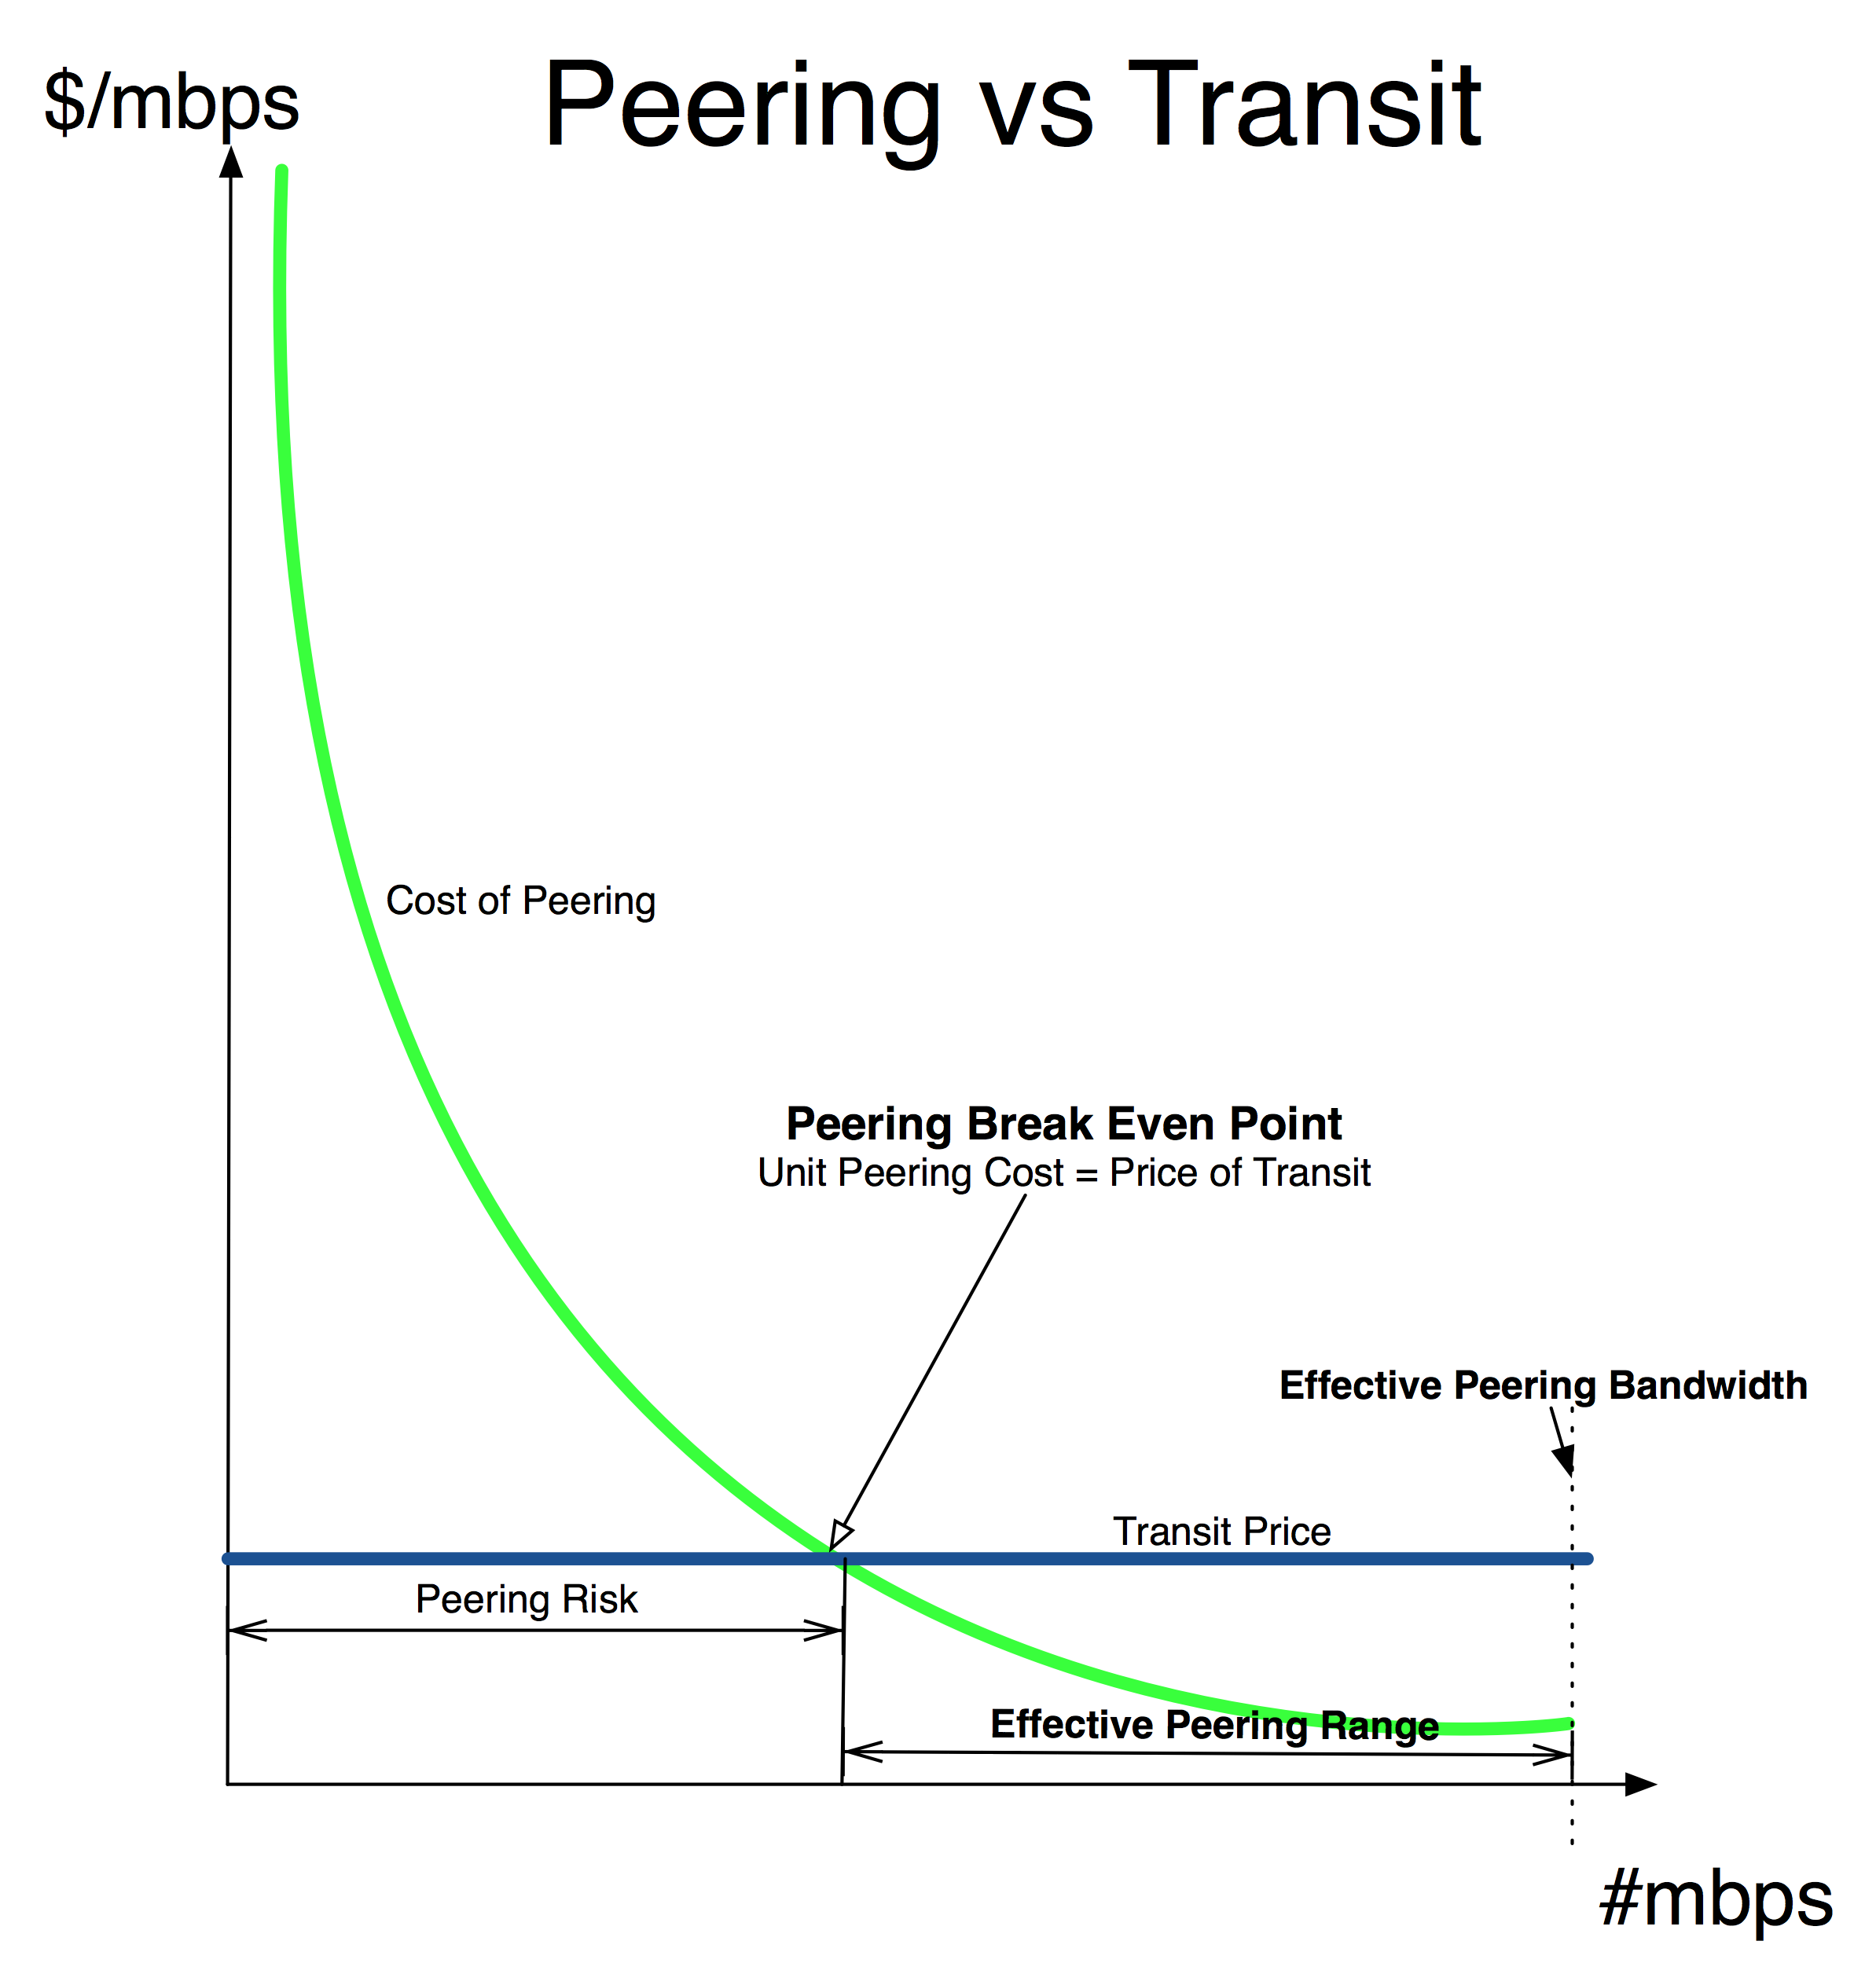
To the right of the break even point (see figure above), ISPs completely cover their peering costs with reduction in transit fees. This savings is proportional to the amount of traffic exchanged with the peering population.
To the left of the Peering Break even Point is the ”Peering Risk”, the possibility of not realizing sufficient peering traffic volume to offset the cost of peering.
The conclusion is clear - if an ISP can exchange more traffic than indicated at the “Peering Break Even Point”, then the ISP should prefer to peer instead of solely purchasing transit from an upstream ISP.
Formulaically, we can calculate the unit cost of peering (per Mbps) as the monthly cost of peering divided by the amount of traffic that can be peered across that infrastructure.
![]()
In 2010, the price of transit is around $5 per Mbps. From a strictly financial position, peering makes sense when the unit cost of peering is less than the cost of transit, that is, when more than $17,000/$5= 3,400 Mbps will be sent to this Exchange Point. We call this the “Peering Break Even Point".
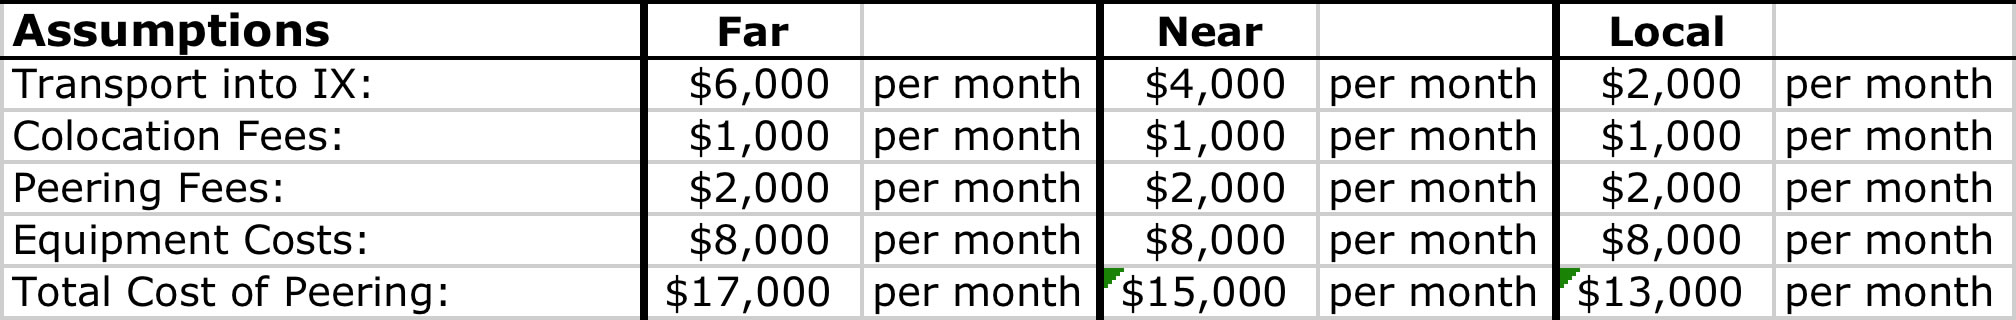
| Assumptions | Far | Near | Local | |||
| Transport into IX: | $6,000 | /month | $4,000 | /month | $2,000 | /month |
| Colocation Fees: | $1,000 | /month | $1,000 | /month | $1,000 | /month |
| Peering Fees: | $2,000 | /month | $2,000 | /month | $2,000 | /month |
| Equipment Costs: | $8,000 | /month | $8,000 | /month | $8,000 | /month |
| Total Cost of Peering: | $17,000 | /month | $15,000 | /month | $13,000 | /month |
| market price at origin | $5.00 | /Mbps | $5.00 | /Mbps | $5.00 | /Mbps |
| market price at dest | $2.00 | /Mbps | $2.00 | /Mbps | $2.00 | /Mbps |
| peeringBreakEven (Mbps) | 3400 | Mbps | 3000 | Mbps | 2600 | Mbps |
| minCostOfTraffic ($/Mbps) | $2.43 | /Mbps | $2.14 | /Mbps | $1.86 | /Mbps |
What is the best price for traffic exchange that we can hope for?
![]()
For modeling purposes we will assume that the Effective Peering Bandwidth is only 70% of the capacity is available for traffic exchange. This takes into account framing overhead, the need for burst ability, and the sinusoidal nature of Internet traffic. So we will assume that we can use 7Gbps of the 10Gbps capacity. This assumption seems to resonate with the Peering Coordinator community.
In the best case scenario we can exchange the Effective Peering Bandwidth worth of traffic for the monthly recurring cost, yielding the best price for traffic exchange that we can hope for:
![]()
If we plug in the numbers we can see that in this best case scenario, traffic exchange with peering can cost as little as $2.43 per Mbps. When we compare this cost for traffic exchange against the "market price for transit at the origin", we can prove that it makes sense to build into the remote Internet Exchange point.
With the analysis so far we can prove that peering financially makes sense if you can peer more traffic than the Peering Break Even Point, and can peer up to the Effective Peering Bandwidth. The Effective Peering Range is the range of peering traffic exchange that makes sense financially.
The table above also covers the local and near cases where the transport costs less.
Let’s summarize in the form of a generalization of the examples we have seen so far in a “Peering Break even Analysis” graph .
The graph below (figure below) generalizes the cost of traffic exchange in a transit relationship against the cost of traffic exchange in peering relationships across an exchange point.
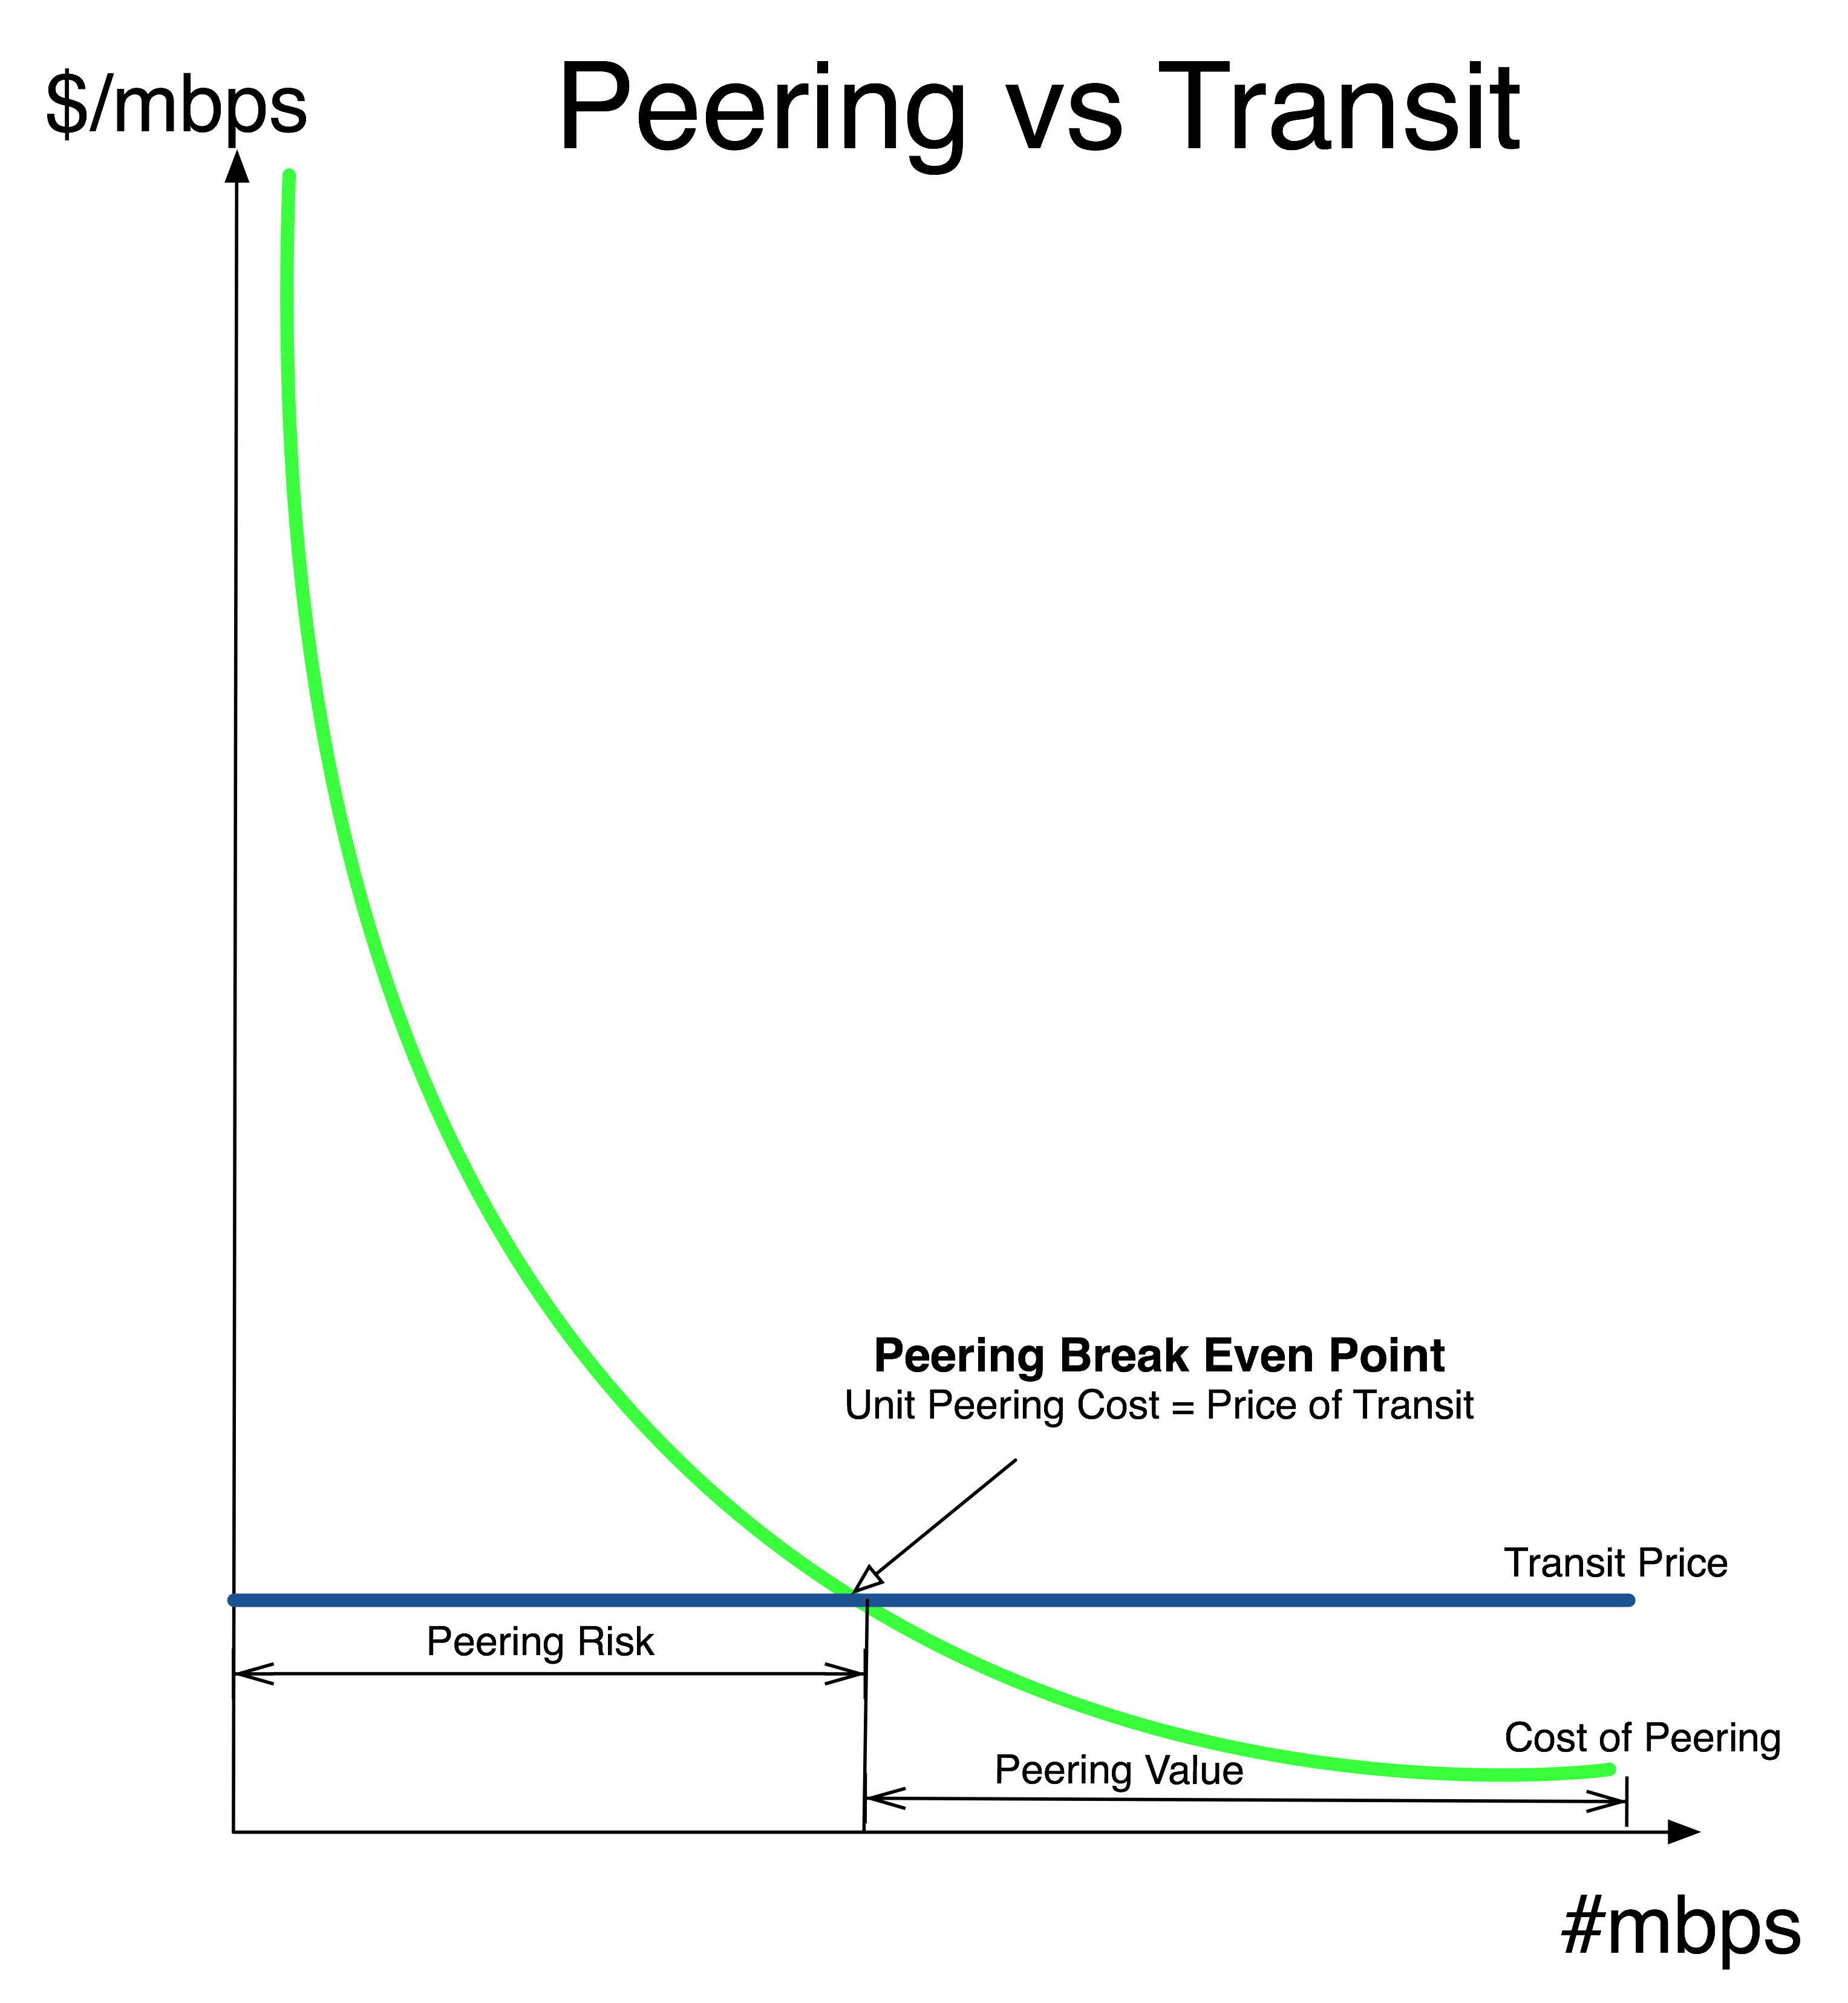
Generalized Peering Break Even Point Analysis Graph
The unit cost of traffic exchange is on the Y-axis in cost-per-Mbps. The X-axis shows the volume of traffic exchanged in Mbps. The cost of transit is shown as a relatively flat unit cost line . The sloped line shows the cost of traffic exchange in a peering relationship.
Peering costs are fixed and include the cost of transport into an exchange, the cost of a partial rack for routing equipment, and the cost of a port on a switch for peering with the exchange population. To compare Peering and Transit, this peering cost is allocated across the amount of traffic exchanged between the ISP and the population of ISPs that are peering with the ISP at the exchange point.
The more traffic exchanged at the peering point, the lower the unit cost of traffic exchanged.
There is a “Peering Break even Point” where ISPs are financially indifferent between peering and simply sending all traffic through its upstream ISP . Once traffic volume between the ISP and the peering population reaches the break even point, ISPs start saving money by peering. The amount of money saved is proportional to the amount of traffic sent to the population of ISPs at the exchange point. The “Peering Risk” is the range of traffic exchange where an ISP fails to exchange enough traffic with the other ISPs at the exchange point to offset the cost of peering.
The amount of traffic sent to the exchange is capped by the minimum of the transport bandwidth and the port bandwidth, termed the “Effective Peering Bandwidth”.
The minimum cost of traffic exchange can be calculated to be the cost of peering divided by the Effective Peering Bandwidth. This is the best price we can hope for when peering over this infrastructure.
The author wishes to express appreciation for the following individuals who assisted and provided valuable feedback during the creation of this document: Frank Orlowski (DE-CIX), Harald Summa (DE-CIX), Job Witterman (AMS-IX), and historically Jeffrey Pappen (Yahoo!), Mitchell Rose (Digital Island), Dennis L. Shreve (FACET Networks), Jon Castle (Comdisco), Jeff Swinton (Conxion), Jalil Sanad Halim (9 Telecom), Glen Larwill, Nick Monjo (PSINet Australia), Tim Griffin (AT&T Research), Rene Hatem (CA*net3), Todd Braning (Level3), Joe Klein (Cogent), Ren Nowlin (Carrier1), Joe Provo (RCN), Vince Fuller (MFN), Mike Leber (Hurricane Electric), Brokaw Price (Yahoo! & Broadcast.com), Waqar Khan (Qwest), John Osman (rigozsaurus.com), Mike Hughes (LINX), Ted Hardie (Equinix), Lane Patterson (Equinix), Jason Starr (Equinix), Nic Lewis (AduroNet), Wolfgang Tremmel (via Net.Works), John Zweibel (Procket networks), James Rice (BBC Internet Services) and Beau Sackett (Telus).
Finally, it is important to highlight some non-financial motivations for peering that lead to less easily quantifiable motivations for peering:
These can have a significant financial impact, but there are also factors that are more difficult to model and quantify. For example, packet loss causes data transfers to time out, and retransmissions cause the data transfer window size to decrease, ultimately resulting in lower aggregate data transfer rate. This means that customers not only have a degraded experience, but the resulting decrease in data transferred, results in the ISP not make as much money either! To maximize revenue therefore, ISPs should seek to minimize packet loss and latency. Peering gives the ISP lower latency (direct path) and lower loss (assuming at least one ISP is motivated) with greater control over the routing.
Conversations with ISPs highlighted a few other subtle advantages to peering as well.
There are some challenges with peering that are highlighted more thoroughly in “Internet Service Providers and Peering”. For example:
All in all, peering can offer substantial benefits for ISPs and large-scale content players that exchange a lot of traffic. The larger the traffic volume and the greater the difference between transit costs and peering costs, the greater the motivation to explore peering as a cost savings strategy.
When it came down to it, most peering coordinators had common motivations for peering and many similar motivations for not peering. These motivations go beyond the business realm but are worth mentioning here. Here is what the peering coordinators said.
1) Lower Transit Costs. Choices made by Internet Service Providers (ISP) are often dominated by telecommunications cost issues. Highest among these costs is Internet Transit service that provides the ISP with connectivity to the global Internet.
To reduce these transit costs, ISPs seek peering (zero or reduced cost paid peering) relationships with other ISPs. These peering relationships provide a more direct path for traffic and reduce the load on these expensive transit services. By contrast, the equivalent peering transport (interconnection circuit) is typically less expensive. This is shown pictorially in the figure below.
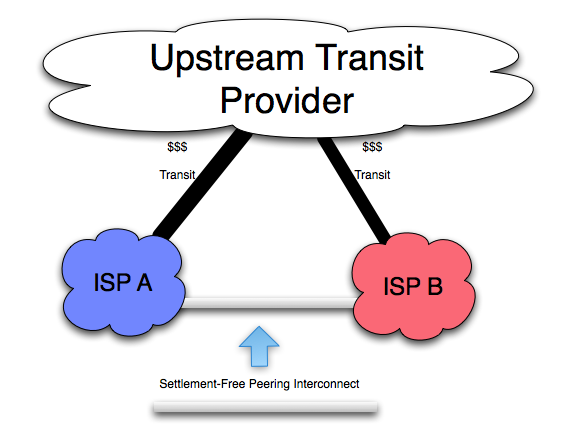
Figure 3 – Migrating traffic from Transit to Peering Interconnection
2) Lower Latency. As a side effect of interconnecting directly with peers, ISP customers experience lower latency to the other ISP’s customers. Traffic destined for a local competitor’s customers may need to traverse a couple of transit providers and potentially across great distances (with high latency) before reaching the other customer. We heard of circuitous paths for example between the United Arab Emirates and Saudi Arabia that traversed an overloaded exchange point (MAE-East) at the time located across the Atlantic Ocean in Washington DC. Through direct peering interconnections (using direct circuits or regional exchange points) ISP customers realize better performance.
3) Usage-based traffic billing. Some ISPs charge customers based upon metered traffic. Since packet loss and latency slows traffic consumption, they benefit from a lower latency, lower packet loss Internet. It is in their best interest therefore to assure that customers use as much bandwidth as possible by minimizing loss and latency through effective traffic engineering . This assertion was first shared with the author by Dave Rand, CTO of AboveNet but is a source of debate among peering coordinators.
4) Marketing Benefits. Some ISP pointed to the benefits of a network diagram rich in interconnections as a proxy for quality as seen by customer prospects.
During the conversations with ISP and Content Player Peering Coordinators, several reasons for not peering were uncovered. The following represents the most common reasons that ISPs have given for not peering:
On the surface, peering appears to be an obviously good idea from a business (financial) and technical perspective. But not all ISPs see peering as automatically providing benefits. Here are the top ten reasons ISPs gave for not peering.
1) Traffic Asymmetry and Investment Asymmetry means that one party bears more of the cost as a result of peering. (See "The Folly of Peering Ratios" for a more complete discussion of this issue. )
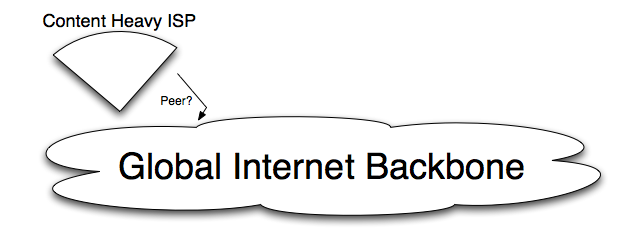
In brief, consider the figure below where a Content Heavy ISP wants to peers with a global Internet backbone. Web traffic (the dominant traffic flow on the Internet) is inherently asymmetric so the Content Heavy ISP is a net source of content,and therefore uses more of the Global backbone provider's resources (bandwidth across the entire path of the network) than the Content Heavy ISP who simply dumps the traffic onto the peer at the peering point.
"I don't want to haul your traffic around the world for free, when I only gain a few peer routes in return."
In some cases ISPs will peer without settlement up to a certain traffic ratio (for example 4:1 traffic out to traffic in) and then de-peer or negotiate on a usage basis beyond that on a Mbps basis . In the Exodus-GTEI depeering-negotiations-repeering, rumor has it that the solution was to peer at more locations and to engineer cold-potato routing to reduce the distance the traffic had to spend on the GTEI backbone .
2) Transit Sales are Preferred. There may be the potential for transit sales if they don’t peer . Some ISPs will not peer if there is any existing or pending customer-provider relationship between the parties, even if the sale is completely unrelated to interconnection (i.e. fiber sale or colo sale) . Ren Nowlin (Onyx/Level 3) described the Level 3 policy here as "Once a customer, never a peer".
3) Ports are for revenue. Peering consumes resources (router interface slots, circuits, staff time, etc.) that could otherwise be used to revenue generation. Router slots, cards, interconnection costs of circuits or Internet Exchange environments, staff install time are incremental expenditures. Further, operating costs, particularly for peering sessions with ISPs without the necessary on-call engineering talent, may require increased processing power for filters, and otherwise take staff time that could be focused on paying customers.
4) Keep Transit Pricing from Sliding, the Motivation not to commoditize IP transit. Tier 1 ISPs compete on the basis of better performance. They accomplish better performance by leveraging a large customer base of direct attachments and high-speed interconnections with other Tier 1 ISPs. Since peering with other ISPs improves the performance of the “peer”, it effectively makes your competitors into a more powerful competitor. Therefore, there is a strong disincentive to peer and increase the number of top tier competitors.
5) Prefer to be a Customer with SLAs. As a “peer” there are no Service Level Agreements (SLAs) to guarantee rapid repair of problems. Both parties are assumed to benefit equally from the interconnect and therefore benefit equally from the reparation of an interconnect outage. There may be clauses in the peering agreements that both parties agree to work diligently to repair the problem. However, a customer relationship (with or without SLAs) generally has more contractual teeth (financial repercussion for failure to perform). There is a category for companies with this Peering Policy: we call it a No-Peering Policy.
6) Traffic Ratio denial. Peering with a Content Heavy ISP will adversely affect peering ratios with other peers that the ISP cares about. See "The Folly of Peering Ratios" for a complete discussion of this issue.
7) Transit is Cheaper. Every year the price of transit has declined as shown in the table below. Why bother with peering when transit is so cheap? This is the perennial question in this sector.
U.S Internet Region
8) Personality Conflicts. Oddly enough, the personalities of the Peering Coordinators, the engineering staff, the executives at the ISPs can have a polarizing effect on the peering process. The Peering Simulation Game even plays this out - often, ISPs that should peer will not peer for non-technical reasons.
9) We aren't true Peers. How ISPs measure themselves can be approximated by their "peers". We are not "true peers" was the reason given as to why ISPs rebuke peering requests from other seemingly good fit peers.
10) We don't have the cycles. Even when there is a good reason to peer, some ISPs simply don't have the people time to set up peering, so they put off peering requests.
Previous versions of this analysis have been prepared and presented in many fora.
Index of other white papers on peering
WIlliam B. Norton is the author of The Internet Peering Playbook: Connecting to the Core of the Internet, a highly sought after public speaker, and an international recognized expert on Internet Peering. He is currently employed as the Chief Strategy Officer and VP of Business Development for IIX, a peering solutions provider. He also maintains his position as Executive Director for DrPeering.net, a leading Internet Peering portal. With over twenty years of experience in the Internet operations arena, Mr. Norton focuses his attention on sharing his knowledge with the broader community in the form of presentations, Internet white papers, and most recently, in book form.
From 1998-2008, Mr. Norton’s title was Co-Founder and Chief Technical Liaison for Equinix, a global Internet data center and colocation provider. From startup to IPO and until 2008 when the market cap for Equinix was $3.6B, Mr. Norton spent 90% of his time working closely with the peering coordinator community. As an established thought leader, his focus was on building a critical mass of carriers, ISPs and content providers. At the same time, he documented the core values that Internet Peering provides, specifically, the Peering Break-Even Point and Estimating the Value of an Internet Exchange.
To this end, he created the white paper process, identifying interesting and important Internet Peering operations topics, and documenting what he learned from the peering community. He published and presented his research white papers in over 100 international operations and research forums. These activities helped establish the relationships necessary to attract the set of Tier 1 ISPs, Tier 2 ISPs, Cable Companies, and Content Providers necessary for a healthy Internet Exchange Point ecosystem.
Mr. Norton developed the first business plan for the North American Network Operator's Group (NANOG), the Operations forum for the North American Internet. He was chair of NANOG from May 1995 to June 1998 and was elected to the first NANOG Steering Committee post-NANOG revolution.
William B. Norton received his Computer Science degree from State University of New York Potsdam in 1986 and his MBA from the Michigan Business School in 1998.
Read his monthly newsletter: http://Ask.DrPeering.net or e-mail: wbn (at) TheCoreOfTheInter (dot) net
Click here for Industry Leadership and a reference list of public speaking engagements and here for a complete list of authored documents
The Peering White Papers are based on conversations with hundreds of Peering Coordinators and have gone through a validation process involving walking through the papers with hundreds of Peering Coordinators in public and private sessions.
While the price points cited in these papers are volatile and therefore out-of-date almost immediately, the definitions, the concepts and the logic remains valid.
If you have questions or comments, or would like a walk through any of the paper, please feel free to send email to consultants at DrPeering dot net
Please provide us with feedback on this white paper. Did you find it helpful? Were there errors or suggestions? Please tell us what you think using the form below.
Contact us by calling +1.650-614-5135 or sending e-mail to info (at) DrPeering.net
DrPeering.net ©2014 | Privacy Policy | Terms and Conditions | About Us | Contact Us
The 2014 Internet Peering Playbook is now available on the iPad at the Apple Store and for the Amazon Kindle. The Kindle, ePub and PDF form are also perpetually updated on the DrPeering DropBox share.